

Designed to meet ECB requirements asking banks to perform comprehensive, sound, and forward-looking physical risk assessments.
Designed to incorporate climate-related and environmental risk considerations into your risk management, governance, ICAAP and disclosures
Written by Christophe Caers, Senior Consultant; Maciej Smółko, Senior Consultant; David Boavida, Consultant and Jaydeep Sengupta, Consultant.
Since the publication of the ECB Guidelines on Climate-Related and Environmental (C&E) risks, banks have been incentivised to continue researching possible ways of integrating C&E risks into their risk management frameworks. At present, risk management functions have been focused on the usage of a stress testing framework to measure their potential exposures under the assumption of one or more transition scenarios. Another point of attention has been the integration of C&E risks into client-acceptance frameworks where new and existing clients are assessed based on their Climate (and often Social & Governance) related performance to align bank portfolios with targets.
As part of Expectation 81 the ECB’s “Guide on climate-related and environmental risks”, banks are expected to consider C&E risks in all stages of the credit process. Although stress testing approaches, granting criteria, and measurements of industry and geography concentrations have partly addressed this issue, direct integration into prudential risk models remains challenging. There are several reasons for this. Banks have only recently started collecting relevant data related to C&E risks and therefore do not have a substantial history that can be relied on to construct statistical models. Moreover, due to the acceleration in terms of both weather events and new climate-policy, the historical relationship between C&E drivers and risk measures is likely not representative of the current or future behaviour.
To address this topic, Finalyse presents a pragmatic approach to incorporate climate risk into a PD model. The conceptual framework leverages on a bank's ability to apply appropriate adjustments during the model development phase of a credit risk model. These adjustments allow certain aspects of the model to be adjusted if there is evidence of representativeness issues. As such, the concept of appropriate adjustments could be used in the setting of C&E risks. Historical data is unable to account for the velocity of current policy adjustments, increases in carbon price and change in global climate. Therefore, the current and past economic cycles are not representative of the inherent risk related to the transition to a sustainable economy. Especially in the context of carbon intensive industries, historical default rates are not representative of the expected risk in the following years and decades. As such, an appropriate adjustment could be applied on the calibration target of those segments with heightened sensitivity to C&E risks.
This article will guide you through a conceptual framework and data-driven implementation of the proposal above.
The first step of our approach is to split the portfolio into two segments. One with high C&E risk vulnerability and other with limited C&E risk vulnerability. To achieve that, a data- and/or regulatory-driven segmentation approach needs to be defined.
According to EBA’s report on “Mapping climate risk: main findings from the EU-wide exercise on climate risk”2 bank’s corporate exposures are classified according to two data classification approaches: the Climate Policy Relevant Sectors (CPRS) methodology and greenhouse gas (GHG) emission-based approaches.
Both approaches allow exposures to be compared and replicated across institutions and sectors consistently. Also, they serve as a starting point on the development of methodologies mapping the standard EU classification of economic activities (i.e., the NACE) into categories that are relevant for climate transition risks.
The CPRS method is a sector-based classification approach developed by Battiston et al. (2017) which provides a standardised and actionable classification of economic activities that could be impacted by a disorderly low-carbon transition. These sectors are identified by evaluating their i) direct and indirect contribution to GHG emissions, ii) relevance for climate policy implementation, iii) role in the energy value chain (technology) and iv) business model (input substitutability of fossil fuel).
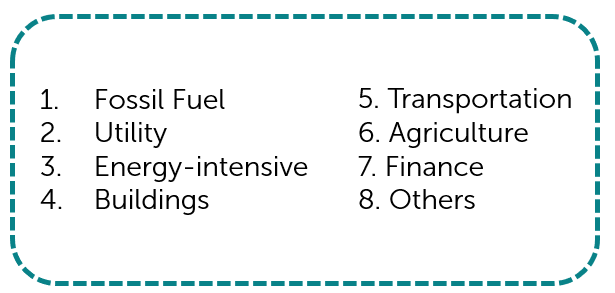
In its essence, it reclassifies NACE classes (4-digit level) into CPRS categories, where exposures to CPRS 1-6 are defined as potentially affected by climate transition risks. These categories, in its most aggregate level, consist of the following:
Even though one limitation may arise when companies operate in multiple business lines and thus, a NACE code won’t capture all the transition risk. The advantage of the CPRS approach lies in its applicability to a large amount of financial assets and comparability across portfolios. Consequently, it is widely used by practitioners and policy makers (EBA, ECB, EIOPA) to assess investor’s exposure to climate risk.
Additionally, not only are CPRS fully compatible with the EU Taxonomy of sustainable activities, but they also allow the mapping of financial investments into the Integrated Assessment Models’ (IAM) variables provided in the Network for Greening the Financial Sectors (NGFS) scenarios. Also, they complement the current EU Taxonomy by covering both low- and high-carbon sectors.
On the EBA’s “Mapping climate risk: main findings from the EU-wide exercise on climate risk” 98% of the €2.3 trillion of exposures collected were classified, since there were NACE codes available for 98% of the data.
Another advantage is that it enables to extend and go beyond the notion of "carbon stranded assets"
This approach consists of mapping the GHG emission intensity of obligors, and then grading sectors’ transition risk based on their carbon intensities. The transition-sensitive sectors are termed “high transition risk sectors (HTRS)”.
To calculate the GHG emission intensity of obligors, their total GHG emissions are divided by their annual consolidated revenues. The obligors can then be classified into NACE level 4 classes. This classification helps create a distribution of banks' exposures based on their emission intensity. This distribution is then used to build different buckets of GHG emission intensity ranges, based on the percentiles of individual companies' data, or to define a cut-off point that splits the sectors into HTRS and non-HTRS.
However, the coverage and accuracy of the data poses some challenges when comparing results with this approach. Additionally, unlike the CPRS methodology, this approach focuses only on identifying large emitters and not capturing other variables/effects crucial to assess the exposure to transition risks.
While the preferred approach in the proposed framework is the CPRS method, other ways to segment the data according to its vulnerability to climate transition risk were studied.
An essential feature of the EU Taxonomy is that activities not categorized as “green”, are not necessarily detrimental. Thus, while evaluating the alignment of financial markets and investors’ portfolios with the Taxonomy is fundamental to assess their progress towards green, it insufficient when it comes to determining their vulnerability to climate transition risk.
In a recent paper by Alessi and Battiston (2021)3, the authors propose an advancement to the CPRS method. To better evaluate the exposures to activities that will necessarily be adversely impacted by the low-carbon transition the authors developed Transition-Exposure Coefficients (TECs). These range from 0, for sectors that don’t need to transition, to 100%, for activities that will need to be abandoned going forward. The approach leverages on the CPRS classification to assign a TEC to each NACE sector with the objective to identify the sectors that are highly exposed to transition risk and thus, to potential losses.
As mentioned, the scope of the paper is limited to the CPRS as they allow a simple binary segmentation. However, it is important to note that the framework hereby described can possibly be extended by incorporating the TECs.
To provide a comprehensive understanding of the model framework, it is important to delve into its foundation and methodology. This section aims to achieve that, by exploring the underlying principles and techniques that form the basis of the model.
Our objective is to calculate the Probability of Default (PD) for each company as well as the corresponding Stressed PDs considering the impact of transition risk through carbon cost imposition. Carbon Stressed PD is the result of re-evaluating the risk profile of a counterparty based on the impacted fundamentals based on the existing internal rating models.

Following are the overarching stages undertaken in formulating the methodological framework for the model.
Data Collection:
Feature Selection:
Pseudo Actual Default Flag Creation:
Applying Carbon Cost Pass Through (CPT) methodology into financial statement:
Training the PD model:
As a first step, all the companies are ranked by their asset size and profit ratio respectively. Final rank is equal to the sum of asset rank and profit rank.
During the second step, a pseudo actual PD is assigned based on a Fibonacci function which follows a general business intuition, i.e., more assets and larger profit indicate lower default risk. Furthermore, the pseudo actual PD is combined with a random component, to factor in the idiosyncratic impact of the individual organizations.
In the final step a Pseudo Default event is assigned to the respective company based on the following formula:

Cost pass-through is a pricing strategy where a business passes on the costs of producing or acquiring a product or service to the customer by increasing the price. This approach is often used by businesses that face volatile input costs, such as raw materials or labour, which can fluctuate based on market conditions or other factors.
The cost pass-through methodology involves analysing the costs associated with producing or acquiring a product or service, and determining how much of those costs can be passed on to the customer. This analysis typically involves considering factors such as the level of competition in the market, the elasticity of demand for the product or service, and the overall price sensitivity of customers. Once the analysis is complete, the business can adjust its pricing strategy to reflect the costs it incurs. For example, if a company sees a significant increase in the cost of raw materials, it may choose to raise its prices to maintain its profit margins. Alternatively, if the company wants to stay competitive in the market, it may choose to absorb some of the increased costs and only pass on a portion to customers.
CPT allows companies to transfer some of the increasing carbon costs to their clients, providing a financial cushion. For the short-term stress test, the balance sheet of the counterparty can be considered fixed, as the increase in carbon price will mainly manifest itself through the income statement. To develop a robust CPT methodology, typically there are three questions that organizations must address. –
The extent to which costs will increase due to a carbon tax depends on various factors, such as the initial tax rate, the sectors and industries affected, the level of carbon emissions reduction required, and the responsiveness of businesses and consumers to the tax.
In general, a carbon tax is designed to increase the cost of goods and services that are produced with high levels of greenhouse gas emissions, such as fossil fuels. However, the actual impact of a carbon tax on costs will depend on the specific design of the tax policy, including any provisions for exemptions, rebates, or offsets. Overall, the impact of a carbon tax on costs is a complex issue that depends on many factors and will vary from industry to industry and from country to country. However, a well-designed carbon tax can provide a powerful incentive for businesses and consumers to reduce their greenhouse gas emissions and transition to cleaner and more sustainable energy sources over time. The following is an illustration of a simplified approach to calculate carbon cost.

Question 2 and 3 need to be considered jointly as the ability of the company to (partly) transfer the increased carbon costs to the consumer will be dependent on the elasticity of the market in which it operates. The company will have to strategically set their price to shift to cost towards the end-consumer while considering a decrease in demand based on the existing price-elasticity. Exogenous cost-pass-through allows sold quantity/revenues to be re-estimated to match with the empirical pass-through rate.

The approach assumes that both the cost-pass-through rate and price elasticity can be estimated in a market equilibrium.
The following illustration depicts the Impact of CPT for a particular organisation having carbon emission of 26,993,000 T, Elasticity 30%, Max price increase (delta): 10% and CO2 price: 258.79 USD/KT.
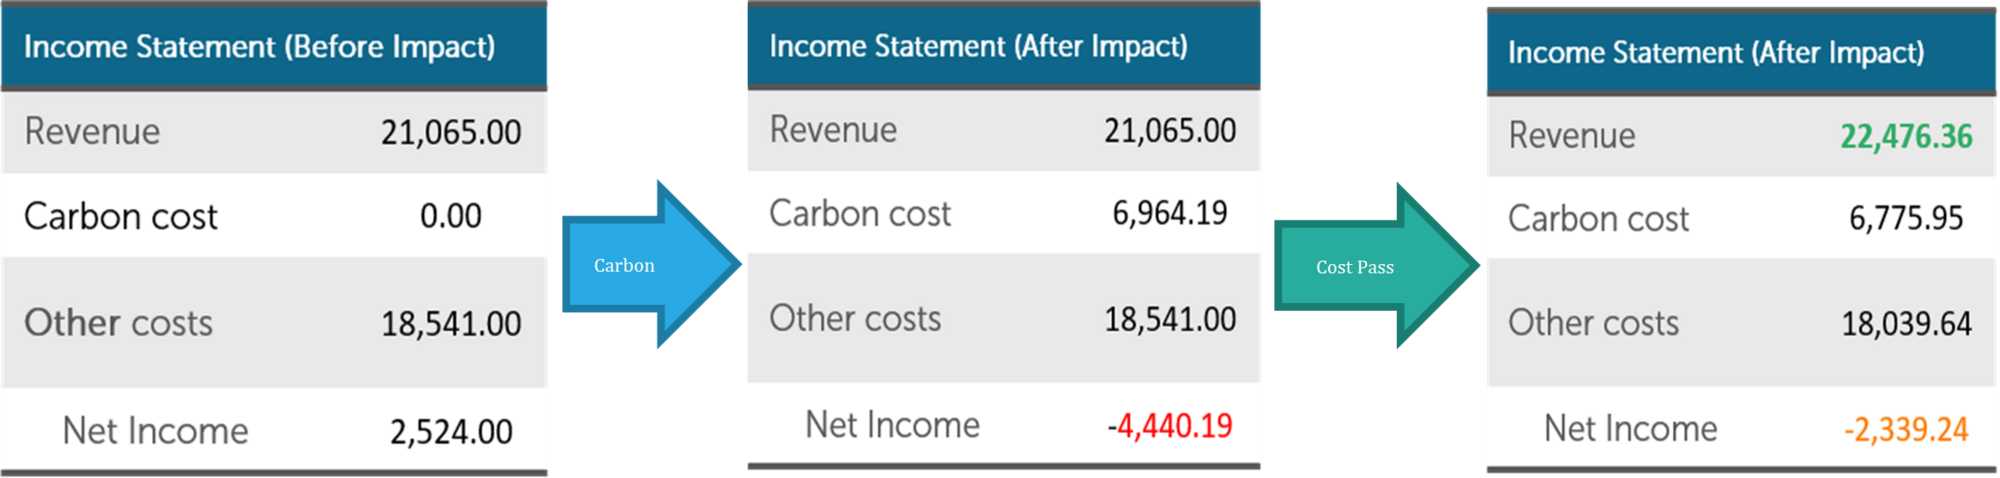
CPT model is applied on all key financial variables of the companies. This allows us to generate stress financial variables for each company which will eventually be used for calculating carbon stressed PDs.
Initially, we performed various pre-processing steps on the data, including removing missing data and outliers and standardizing the data. The remaining data is split into training and test subsets. Then we considered several classification models such as Logistic Regression, Decision Tree, Support Vector Machines, Naive Bayes Approach, Random Forest, XGBoost. Subsequently, we trained and evaluated each model using the training and test data using various performance metrics. Finally, based on results and nature of the objective we chose logistic model to predict the baseline & carbon stressed PD respectively. The ensuing section shall encompass a detailed analysis and contemplation of the outcomes.
When the Profit & Loss results stressed with additional carbon price are applied to the same model as discussed in the above section, the probability of default (PD) increased across all Climate Policy Relevant Sectors (CPRS). This finding highlights the pervasive, expected impact of rising carbon pricing on some corporates’ financial stability.
The model takes into consideration that companies with higher elasticity of demand experience greater difficulty in passing on these costs to customers, resulting in a larger financial effect and a higher PD. Cost pass-through, a mechanism that allows businesses to pass on some of the rising carbon prices to their customers, can provide a financial buffer.
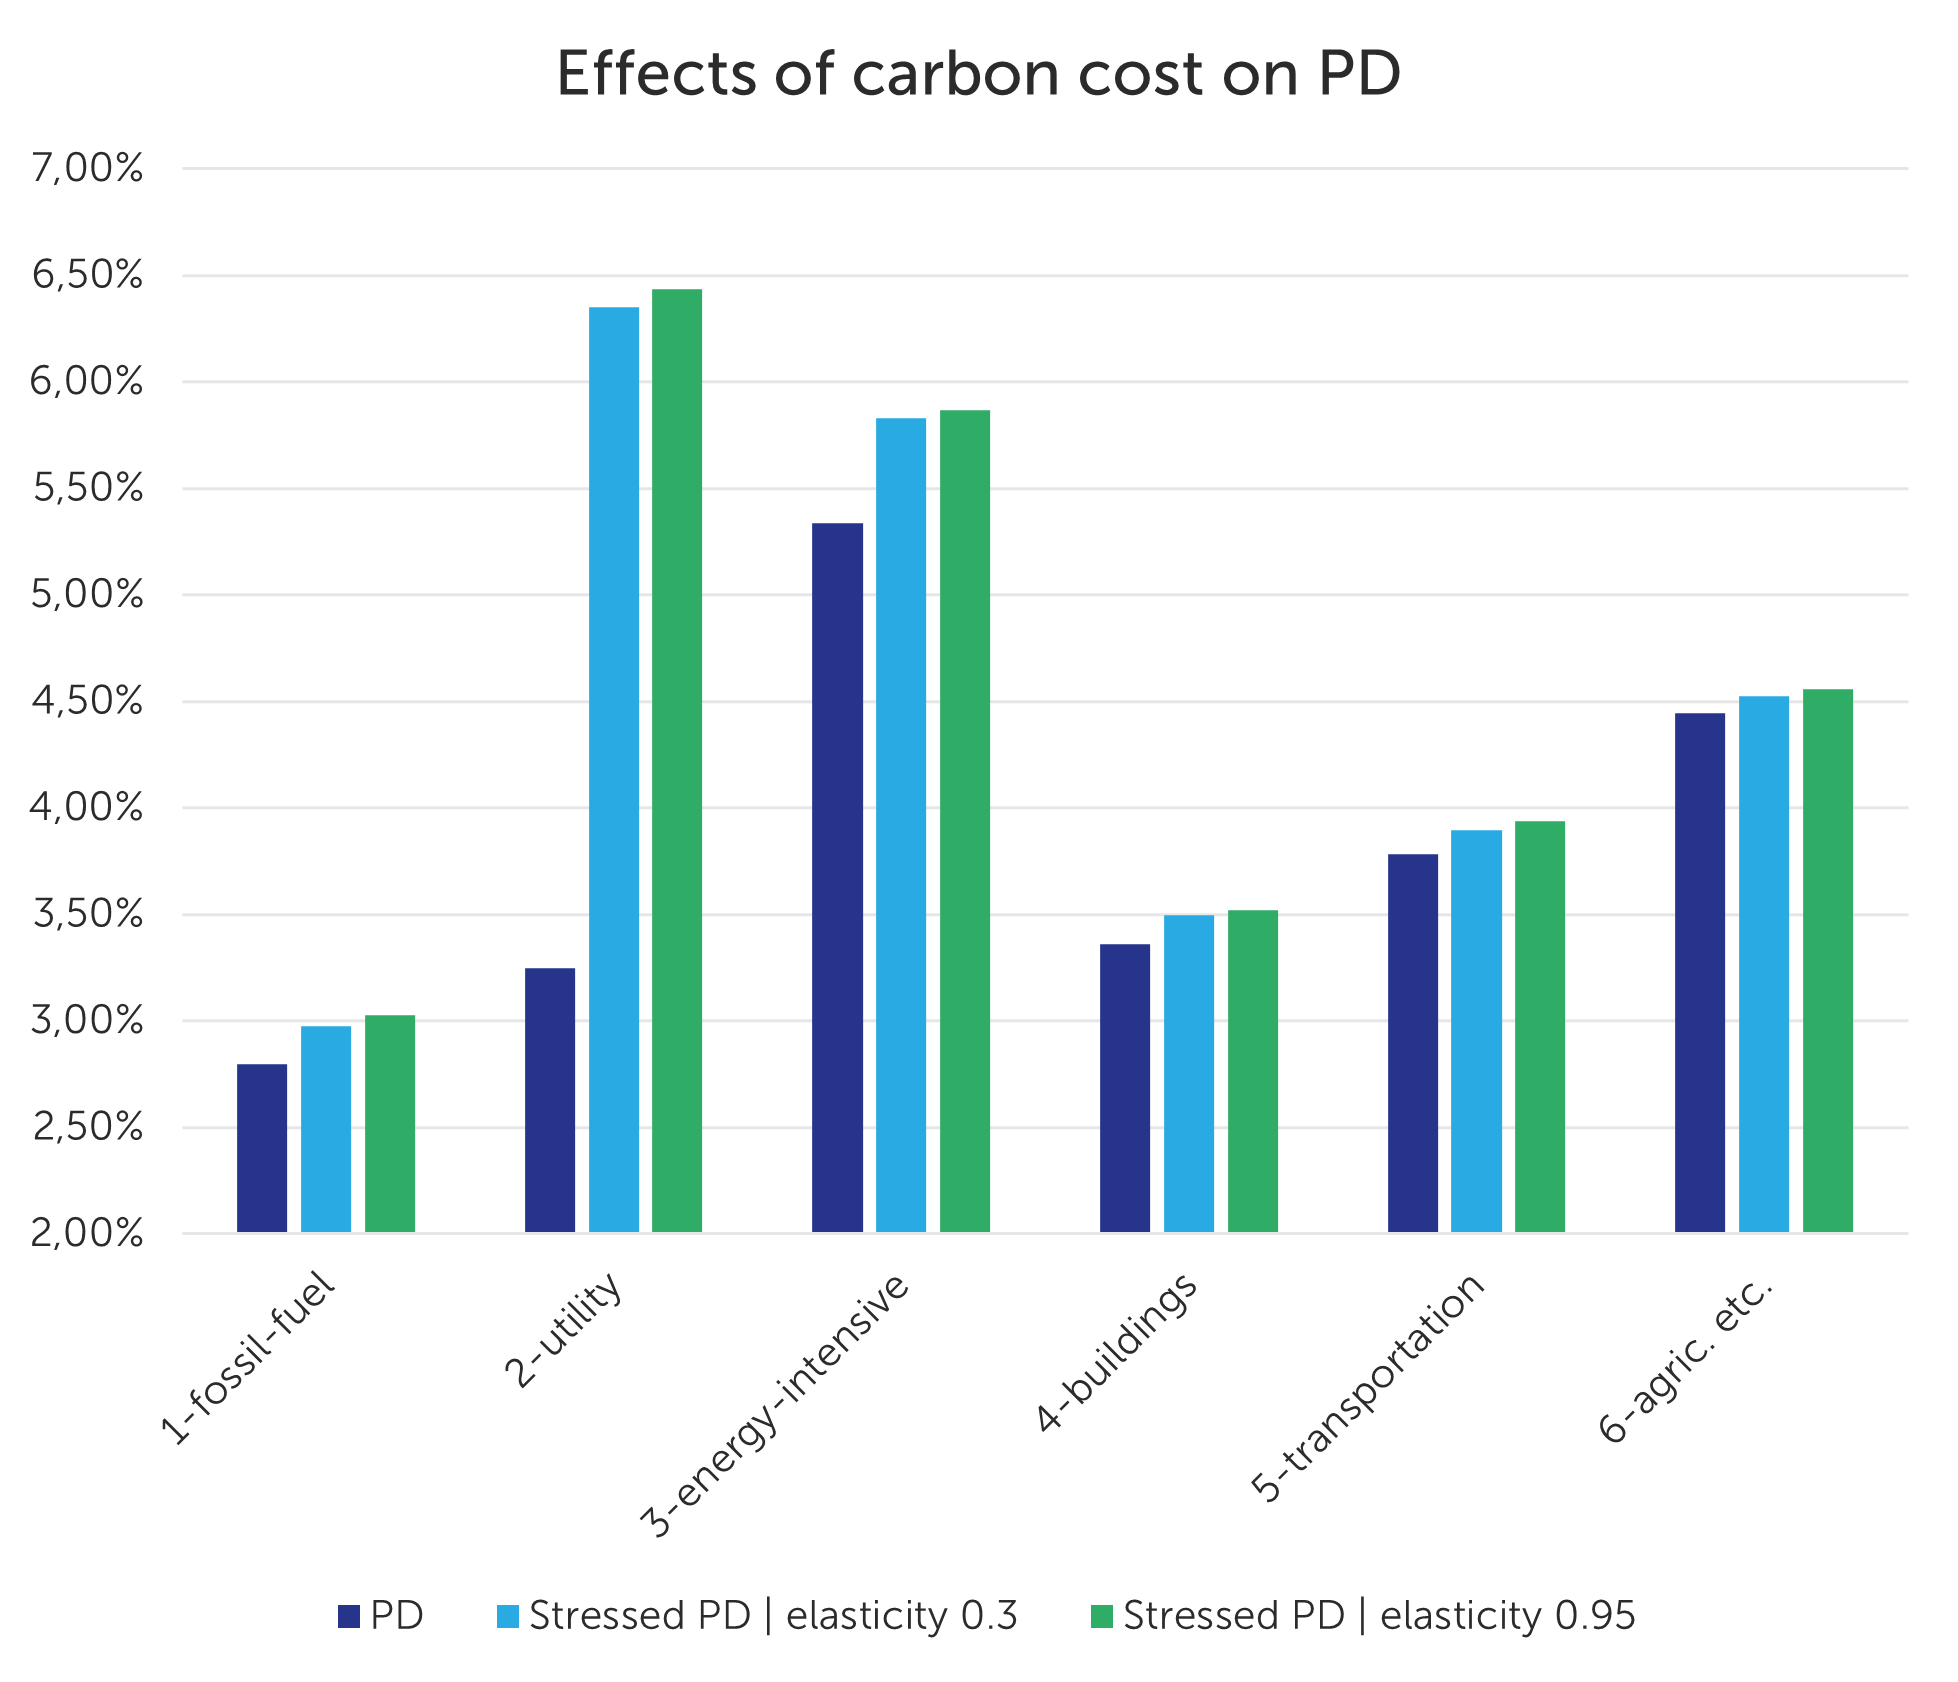
However, it is important to note that for a significant percentage of companies, carbon costs, even when multiplied by a relatively high carbon price of 259 USD, do not constitute a substantial portion of their revenues. Consequently, these costs do not considerably increase their PD. This observation suggests that the impact of carbon pricing on PD may vary depending on the size of the company, its industry, and its exposure to carbon-intensive operations.
The implementation of carbon pricing has the greatest impact on utility firms; however, this conclusion could be influenced by the specific dataset utilized in the analysis. Some traditionally carbon intensive companies recorded highest profits in 2022, so the results may not be representative for whole sectors. More inquiry is required to corroborate these findings across multiple businesses and datasets to provide a more thorough knowledge of the impact of carbon taxes on diverse sectors.
Further research in this area might validate the additional impact of elasticity on the relationship between carbon costs and the probability of default. Furthermore, the maximum price increase capacity set utilized in the model can be defined more dynamically, ensuring a more robust examination of the factors impacting probability of default. Incorporating Scope 3 emissions and mechanism simulating lagging market dynamics into the model may aid in capturing the indirect and long-term implications of carbon pricing on enterprises' future P&L and PD.
Integrating transition risks into risk factors shows a significant change in obligors’ financial health. This article highlights one of the approaches for financial institutions to coalesce climate risk into their risk estimation operation aligning with recent regulatory guidance. As discussed above the approach can be further modified based on the financial institution’s own portfolio. The results also outline foundation for setting up climate risk stress testing and transition risk identification method.
Finalyse Climate Risk Management team is a trusted & reliable partner that helps you establish the climate risk modelling practice. We understand the complexities involved and have the strong expertise to guide you through the process.
HOW CAN FINALYSE MAKE A DIFFERENCE?

Finalyse InsuranceFinalyse offers specialized consulting for insurance and pension sectors, focusing on risk management, actuarial modeling, and regulatory compliance. Their services include Solvency II support, IFRS 17 implementation, and climate risk assessments, ensuring robust frameworks and regulatory alignment for institutions. |

Check out Finalyse Insurance services list that could help your business.
Get to know the people behind our services, feel free to ask them any questions.
Read Finalyse client cases regarding our insurance service offer.
Read Finalyse blog articles regarding our insurance service offer.
Designed to meet regulatory and strategic requirements of the Actuarial and Risk department
Designed to meet regulatory and strategic requirements of the Actuarial and Risk department.
Designed to provide cost-efficient and independent assurance to insurance and reinsurance undertakings
Finalyse BankingFinalyse leverages 35+ years of banking expertise to guide you through regulatory challenges with tailored risk solutions. |

Designed to help your Risk Management (Validation/AI Team) department in complying with EU AI Act regulatory requirements
A tool for banks to validate the implementation of RWA calculations and be better prepared for CRR3 in 2025
In 2027, FRTB will become the European norm for Pillar I market risk. Enhanced reporting requirements will also kick in at the start of the year. Are you on track?
Finalyse ValuationValuing complex products is both costly and demanding, requiring quality data, advanced models, and expert support. Finalyse Valuation Services are tailored to client needs, ensuring transparency and ongoing collaboration. Our experts analyse and reconcile counterparty prices to explain and document any differences. |

Helping clients to reconcile price disputes
Save time reviewing the reports instead of producing them yourself
Helping institutions to cope with reporting-related requirements
Be confident about your derivative values with holistic market data at hand
Finalyse PublicationsDiscover Finalyse writings, written for you by our experienced consultants, read whitepapers, our RegBrief and blog articles to stay ahead of the trends in the Banking, Insurance and Managed Services world |

Finalyse’s take on risk-mitigation techniques and the regulatory requirements that they address
A regularly updated catalogue of key financial policy changes, focusing on risk management, reporting, governance, accounting, and trading
Read Finalyse whitepapers and research materials on trending subjects
About FinalyseOur aim is to support our clients incorporating changes and innovations in valuation, risk and compliance. We share the ambition to contribute to a sustainable and resilient financial system. Facing these extraordinary challenges is what drives us every day. |

Finalyse CareersUnlock your potential with Finalyse: as risk management pioneers with over 35 years of experience, we provide advisory services and empower clients in making informed decisions. Our mission is to support them in adapting to changes and innovations, contributing to a sustainable and resilient financial system. |

Get to know our diverse and multicultural teams, committed to bring new ideas
We combine growing fintech expertise, ownership, and a passion for tailored solutions to make a real impact
Discover our three business lines and the expert teams delivering smart, reliable support