

Unlock capital efficiency with expert SRT transaction support
Simulation-driven capital floor optimisation
Designed to meet CRR amd CRD regulatory requirements for banks
The highest possible predictive power of your models

Maël Kerbaul is a Senior Consultant with over 15 years of experience in the banking and financial industry, especially in risk management. His main area of expertise lies in the credit risk management and regulatory capital calculation. He has developed a broad knowledge of Basel IV/CRR3 while he played a major role in the impact assessment of this new regulation at a large financial institution in Belgium. Maël has also a wide experience in data analysis for credit risk and has a good command of SAS EG and SQL.
The regulatory treatment of securitisation has been the matter of intense discussions over the past months. Participants worry that CRR3 implementation would reduce the attractiveness of securitisation and even question its economic viability.
Essential tool for funding, risk transfer and balance-sheet management, the beneficial role of securitisation to the real economy is widely recognized and acknowledged, by the European regulator itself 1. However, the European securitisation market has severely declined since the 2008 financial crisis 2 and remains underdeveloped compared to similar markets in other parts of the world.
Among other reasons, a too restrictive regulation is often pointed out as a main factor of this poor performance. In this context, while the EU Securitisation Framework in force since 2019 will remain untouched by CRR3, the introduction of the Output Floor will add another layer of conservatism to the securitisation treatment. The Output Floor, that aims to limit the benefits of using internal models to measure capital requirements for banks, will significantly reduce the securitisation efficiency to free up capital.
Although the last amendments adopted after the trialogue discussions in 2023 comprise transitional arrangements that will smoothen the impact of the Output Floor on securitised positions, worries are persisting for the long-term efficiency of newly issued programs that are typically planned to produce effects over several years. In this article, we will explore in detail the mechanisms affecting securitisation efficiency under CRR3.
1. See the 2022 Report from the Commission to the European Parliament and the Council on the functioning of the Securitisation Regulation: “This tool, therefore, makes a significant contribution to a well-functioning financial system that efficiently finances the real economy, as it frees up capacity on banks' balance sheets, which enables them to provide new credit to businesses, including small and medium-sized companies. It acts as an important tool for capital, liquidity and risk management in banks.”
2. See 2023 article from ESMA ESMA provides overview of EU securitisation markets
The Capital Requirements Regulation (“CRR” – Reg. EU No 575/2013, Chapter 5, Title II, Part Three), amended by the “New Securitisation Framework” (Reg. EU 2017/2401), applicable since 2019, defines three methods to calculate the minimum capital requirements for securitised positions:
For each approach, the CRR employs different methodologies for risk-weighted assets (RWA) computation, with different parameter levels, risk weight floors and treatments for STS (Simple, Transparent and Standardised) securitisations. More details about the EU Securitisation Framework are discussed in our article Finalyse: The EU Securitisation Framework from March 2022.
These three methods will remain applicable and unchanged by CRR3 amendments. However, for the purpose of the Output Floor computation, CRR3 prescribes to use either the SEC-SA or, when eligible, the SEC-ERBA approaches (Article 92(5)), which are much more penalizing than the SEC-IRBA.
To assess a bank’s current compliance status, a comprehensive gap analysis is important. This initial step is instrumental in establishing a robust foundation for the subsequent processes. The comprehensive evaluation entails a review of the bank's operational landscape, policies, procedures and internal controls to identify any misalignments between the bank’s current practices and the requirements outlined by the ECB’s guidelines. This process serves as a cornerstone for prioritizing assessment efforts and approaching them accordingly.
The risk weight functions for securitisation exposures are defined in Articles 259 to 262 of the CRR.
The main drivers for the risk weight of the senior tranche are the capital charge of the underlying pool (KIRB or KSA), the tranche thickness (measured through the attachment and detachment points) and the supervisory parameter (p-factor).
The capital charge of the underlying pool KIRB and KSA are defined in Article 255 as the ratio of 8% of the RWA on the exposure at default (EAD). KIRB also includes the expected loss (EL).
KIRB = (8%*RWA + EL) / EAD, where the RWA are measured under IRB approach
KSA = (8%*RWA) / EAD, where the RWA are measured under SA approach
The attachment point represents the level at which losses start to be allocated to the senior tranche, expressed as a decimal between 0 and 1. It is identical in SEC-IRBA and SEC-SA.
The detachment point represents the level at which the losses result in a total loss for the tranche. It is deemed equal to 100% for the senior tranche.
The p-factor is a supervisory parameter that represents a premium capital charge aiming to capture the agency risk and other specific risks embedded in securitisations. In SEC-IRBA, the p-factor is modelized based on different components including the effective number of exposures in the pool, the average LGD of the pool and the maturity of the tranche, and floored to 0.3. In SEC-SA, the p-factor is fixed to 1 or 0.5 for STS programs, considering that programs respecting STS criteria present fewer risks.
| SEC-IRBA | SEC-SA |
Capital charge of the underlying pool | KIRB (measured through internal models) | KSA (measured under Standardised Approach) |
Attachment Point | Level at which losses start to be allocated to the senior tranche | |
Detachment Point | Deemed 100% for the senior tranche | |
p-factor | Modelized, floored at 0.3 | 1 for non-STS securitisations 0.5 for STS securitisations |
The level of the p-factor in SEC-SA is often criticized by the industry as exaggeratedly increasing the capital requirement for securitised positions on the ground of covering risks that are empirically limited. Its level constitutes the main reason for the impact of the Output Floor on securitisation efficiency. Responding to these critics, the European regulator has reviewed its position in the direction of smoothening the impact of the Output Floor on securitisation. The first draft of the Commission from October 2021 contained no specific provision regarding securitisation. In the last outcomes of the trialogue that concluded at the end of 2023, a reduction of the p-factor was agreed upon. The level of the p-factor to be applied in the SEC-SA must be divided by 2 in the final text that is expected to be published in April 2024 (that is 0.5 for non-STS and 0.25 for STS securitisation) but solely for the calculation of the Output Floor and as a transitional arrangement until December 31st, 2032 (Article 465-7).
Level of the p-factor in SEC-SA | Until 2032 | Beyond 2032 |
Non-STS securitisation | 0.5 | 1 |
STS securitisation | 0.25 | 0.5 |
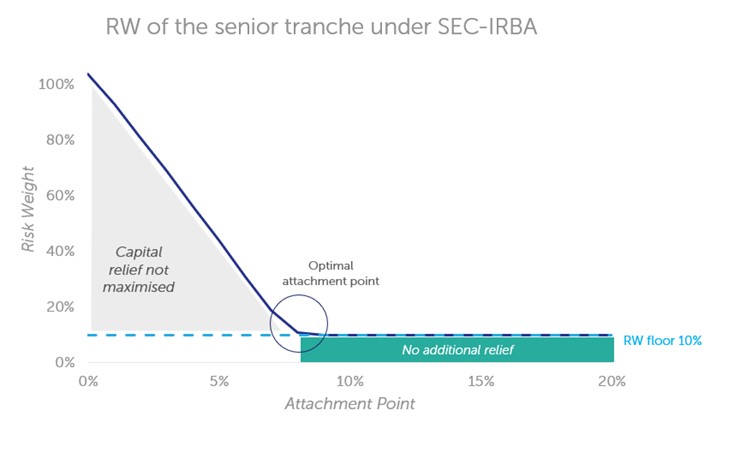
Most securitisation programs issued by European banks are built to be efficient under the SEC-IRBA. The capital relief is optimized when the risk weight of the senior tranche retained by the bank is as close as possible to the risk weight floor of 15% (or 10% for STS securitisations). The different parameters of the securitisation program are fine-tuned to reach this floor, in particular the thickness of the different tranches.
In the chart below, the attachment point on the x-axis represents the threshold at which losses start to be allocated to the senior tranche. The higher this level, the lower the risk left on the senior tranche, and consequently the lower the risk weight applied to this tranche. The optimal level for the attachment point is the level at which the risk weight floor is reached.
If the attachment point is lower than this optimum, the risk transfer and the capital relief are not maximized. On the opposite, if the attachment point is too high, the marginal cost of transferring risk is not compensated by a supplementary capital relief, because of the risk weight floor applicable to the senior tranche.
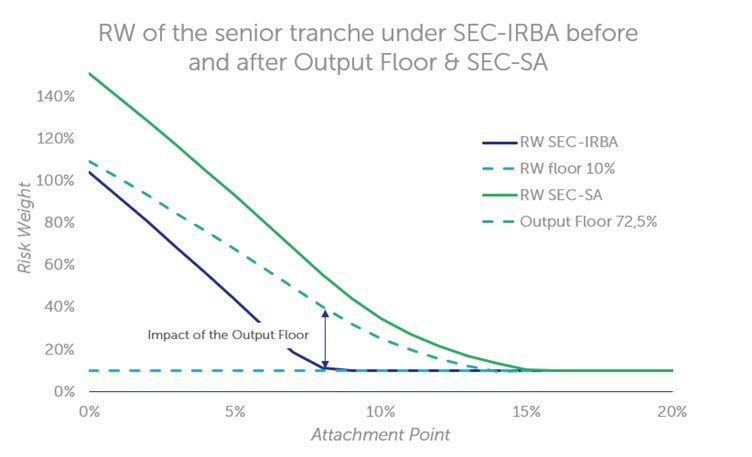
However, when measured under the SEC-SA approach, the risk weight of the retained tranche will often exceed this floor and result in a significantly higher capital charge for the bank. This is explained by two cumulative adverse factors: the total RWA of the reference portfolio pre-securitisation is generally higher when measured under SEC-SA than under SEC-IRBA (depending on the nature of the assets composing the portfolio 3), and the risk weight function under SEC-SA is more conservative than under SEC-IRBA, in particular because of the higher level of the p-factor.
These two effects result in a significantly higher risk weight for the senior tranche for a same securitised portfolio, with an attachment point and all other characteristics being equal. An attachment point located in the area of 8% to 12% is generally sufficient to reach the risk weight floor on the senior tranche under SEC-IRBA. However, an 8% to 12% tranche might well result in a risk weight around 60% or 70% when measured under SEC-SA, which clearly reduces the economic interest of the securitisation. To remain economically efficient under SEC-SA, securitisation structures would need to change with thicker mezzanine tranches, which would considerably increase the cost of the risk transfer.
3. A study from November 2022 conducted by AFME shows that a securitisation portfolio comprised of large corporates and SME loans would be more severely impacted by the Output Floor, while residential mortgage and other retail loans portfolios would be positively impacted. See Research Report: Impact of the SA Output Floor on the European Securitisation Market | AFME
Through this example, we can more concretely observe the impact of the Output Floor on a securitisation program efficiency, and in particular the impact of the p-factor level. The characteristics chosen are typical of a corporate loans portfolio. As mentioned previously, not all securitisation programs will present such an extreme behaviour depending on the composition of the portfolio. For the sake of simplicity, we assume that the portfolio has no currency mismatch.
EAD = 1bn€
RWA CRR2 = 45%
RWA CRR3 IRB = 45%
RWA CRR3 SA = 90%
Attachment point A = 8%
Detachment point D = 100%
Ratio of delinquent exposure W = 2%
Parameters | Formula | Non-STS | STS | STS (under transitional arrangement) |
p-factor | Fixed value | 1 | 0.5 | 0.25 |
KSA | KSA = (8%*RWA CRR3 SA) / EAD | 7.2% | 7.2% | 7.2% |
KA | KA = (1-W)*KSA + W*0.5 | 8.1% | 8.1% | 8.1% |
a | a = -(1 / (p * KA)) | -12.41 | -24.83 | -49.65 |
u | u = D - KA | 0.919 | 0.919 | 0.919 |
l | l = max (A - KA ; 0) | 0 | 0 | 0 |
KSSFA(KSA) | KSSFA(KSA) = (eau – eal) / a(u-l) | 0.0876 | 0.0438 | 0.0219 |
RW SEC-SA | See below | 110% | 55% | 28% |
Risk weight formula for SEC-SA is defined as below:
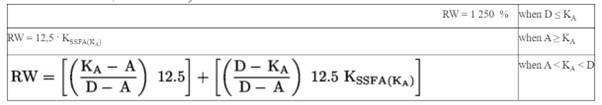
Considering the EAD of the senior tranche is 1bn€*92% = 920m€ (i.e. deduction of the 80m€ of the mezzanine tranche sold), we can measure the RWA pre- and post-securitisation under the three hypotheses. We can then deduct the securitisation efficiency as the ratio of the RWA relief on the pre-securitisation RWA.
RWA in m€ | Pre-securitisation | Non-STS (p-factor = 1) | STS (p-factor = 0.5) | STS under transitional arrangement (p-factor = 0.25) |
RWA remaining after securitisation (IRBA) | 450 | 138 | 92 | 92 |
RWA remaining after securitisation (SA) | 900 | 1.012 | 506 | 257.6 |
RWA after Output Floor 72.5% | 652.5 | 733.7 | 366.9 | 186.8 |
Efficiency before/after Output Floor | 0% / 0% | 69% / -12.4% | 80% / 44% | 80% / 71% |
We can see that the securitisation efficiency improves drastically as the p-factor diminishes. However, even under the most favorable hypothesis of a p-factor of 0,25 (that will apply to STS securitisation until 2032), the efficiency after Output Floor is lower than it was in IRBA.
While the Chapter 5 of the CRR defining the RWA calculation for securitised positions is not touched by the upcoming revision, we have seen that the introduction of the Output Floor will have a major impact on securitisation efficiency to release capital. This impact will be variable depending on the nature of the programs. The corporate loans portfolio will be particularly penalized.
The European regulator has acknowledged this negative impact and proposed temporary measures that will soften this impact until 2032, even though it will remain material for many actors.
Banks will have to adapt to this new deal. Obtaining the STS label is more than ever a necessity to keep the Output Floor impact within acceptable limits. Beyond 2032, unless the regulator agrees to soften the securitisation treatment under the SEC-SA or to entrench the temporary levels of the p-factor, banks would have to rethink the structure of their programs. A way to improve the efficiency would be to increase the thickness of the mezzanine tranches, which will result in an increase of the price of the risk transfer and also depend on the market appetite for riskier tranches.
CRR3 introduces the Output Floor, requiring that internally modelled capital requirements must not fall below 72.5% of those calculated under the standardised or external ratings-based approaches. This can increase regulatory capital requirements for securitisation exposures, reducing the capital relief typically achieved.
No, for the purposes of the Output Floor, only the SEC-SA or SEC-ERBA approaches are used to calculate standardised capital requirements. SEC-IRBA is not used in Output Floor calculations, although it remains valid for Pillar 1 RWA computation.
The main drivers are the capital charge for the underlying pool (K_IRB or K_SA), the attachment and detachment points of the tranche, and the p-factor, which is a supervisory parameter. The p-factor is modelled (with a floor) in SEC-IRBA and fixed in SEC-SA (1.0 for non-STS and 0.5 for STS).
Finalyse InsuranceFinalyse offers specialized consulting for insurance and pension sectors, focusing on risk management, actuarial modeling, and regulatory compliance. Their services include Solvency II support, IFRS 17 implementation, and climate risk assessments, ensuring robust frameworks and regulatory alignment for institutions. |

Check out Finalyse Insurance services list that could help your business.
Get to know the people behind our services, feel free to ask them any questions.
Read Finalyse client cases regarding our insurance service offer.
Read Finalyse blog articles regarding our insurance service offer.
Designed to meet regulatory and strategic requirements of the Actuarial and Risk department
Designed to meet regulatory and strategic requirements of the Actuarial and Risk department.
Designed to provide cost-efficient and independent assurance to insurance and reinsurance undertakings
Finalyse BankingFinalyse leverages 35+ years of banking expertise to guide you through regulatory challenges with tailored risk solutions. |

Designed to help your Risk Management (Validation/AI Team) department in complying with EU AI Act regulatory requirements
A tool for banks to validate the implementation of RWA calculations and be better prepared for CRR3 in 2025
In 2027, FRTB will become the European norm for Pillar I market risk. Enhanced reporting requirements will also kick in at the start of the year. Are you on track?
Finalyse ValuationValuing complex products is both costly and demanding, requiring quality data, advanced models, and expert support. Finalyse Valuation Services are tailored to client needs, ensuring transparency and ongoing collaboration. Our experts analyse and reconcile counterparty prices to explain and document any differences. |

Helping clients to reconcile price disputes
Save time reviewing the reports instead of producing them yourself
Helping institutions to cope with reporting-related requirements
Be confident about your derivative values with holistic market data at hand
Finalyse PublicationsDiscover Finalyse writings, written for you by our experienced consultants, read whitepapers, our RegBrief and blog articles to stay ahead of the trends in the Banking, Insurance and Managed Services world |

Finalyse’s take on risk-mitigation techniques and the regulatory requirements that they address
A regularly updated catalogue of key financial policy changes, focusing on risk management, reporting, governance, accounting, and trading
Read Finalyse whitepapers and research materials on trending subjects
About FinalyseOur aim is to support our clients incorporating changes and innovations in valuation, risk and compliance. We share the ambition to contribute to a sustainable and resilient financial system. Facing these extraordinary challenges is what drives us every day. |

Finalyse CareersUnlock your potential with Finalyse: as risk management pioneers with over 35 years of experience, we provide advisory services and empower clients in making informed decisions. Our mission is to support them in adapting to changes and innovations, contributing to a sustainable and resilient financial system. |

Get to know our diverse and multicultural teams, committed to bring new ideas
We combine growing fintech expertise, ownership, and a passion for tailored solutions to make a real impact
Discover our three business lines and the expert teams delivering smart, reliable support