

Principles for effective Risk Data Aggregation, IT Infrastructure and Governance: turn regulatory obligation to operational and strategic benefits
Automate functional testing and reporting for financial risk regulatory domain

Varadharajan Sevilimedu Veeraragavan is a seasoned regulatory reporting and financial risk expert, with deep specialization in liquidity and interest rate risk, data quality governance, and regulatory compliance. His core expertise lies in the validation, control, and governance of key financial risk indicators and regulatory reports across complex global banking operations. Varadharajan brings strong technical capabilities, including advanced proficiency in Excel, hands-on experience with data quality tools, and is currently pursuing certification as an Alteryx Core Designer.
This article introduces a pragmatic framework to help banks rationalise their Critical Data Elements (CDEs) and focus on the data that directly drives risk, capital, and liquidity metrics. As BCBS 239 programmes have matured, many institutions have moved from under-identification to over-classification of CDEs, creating complexity without necessarily improving control. This paper sets out an approach to bring discipline and proportionality back into CDE identification.
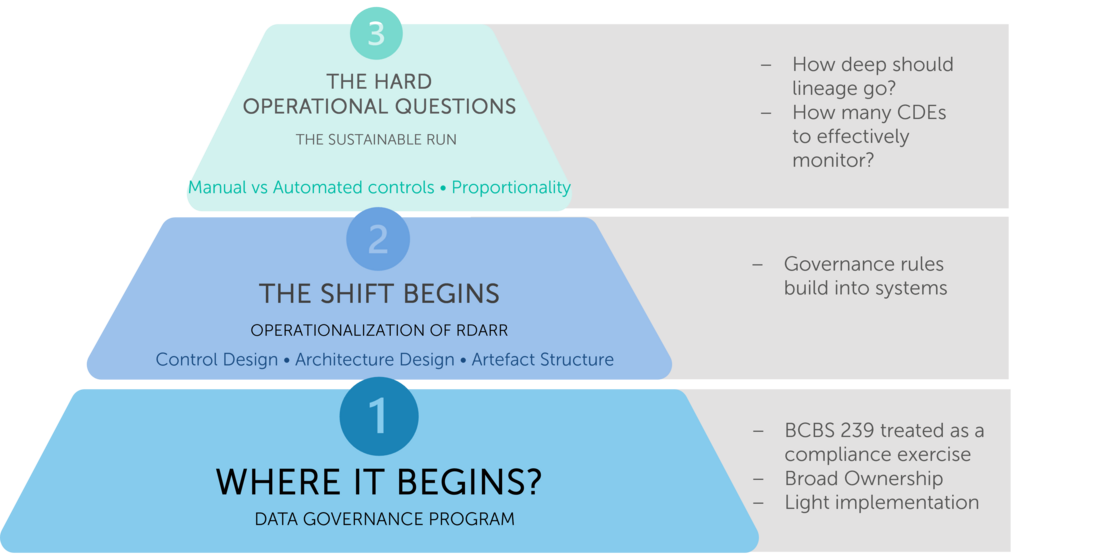
When BCBS 239 was introduced, banks treated it largely as a regulatory compliance programme: build the ability to aggregate risk data accurately and deliver reliable reports at speed, especially under stress. In practice, translating high‑level principles into operational change proved complex, and many institutions started with documentation: risk‑report inventories, data dictionaries, lineage maps, and governance charters.
But as the program evolved, Banks were asked to demonstrate that key metrics, such as risk‑weighted assets, expected credit loss, or liquidity coverage ratios, could be traced back to originating systems, with robust controls across each transformation layer. This pushed programmes beyond policy into the “plumbing” of risk data.
As institutions mapped regulatory templates to systems and models, recurring structural issues emerged. A single credit RWA figure might depend on exposures drawn from several loan systems using different conventions for collateral valuation or default status. IFRS 9 ECL calculations often combined PD, LGD, and EAD sourced from different model repositories, with inconsistent treatment of cure, forbearance, or write‑off events. Liquidity metrics such as LCR and NSFR frequently relied on maturity and run‑off assumptions interpreted differently by treasury, ALM, and lending platforms. Even basic counterparty identifiers or product hierarchies were not aligned across credit risk, market risk, and finance.
Once end‑to‑end lineage was traced, it became obvious that not all attributes were equal. Some data elements are structurally critical: without consistent exposure amounts, maturities, ratings, or identifiers, core risk and capital metrics cannot be calculated, reconciled, or explained. Many banks arrived, implicitly, at the concept of Critical Data Elements, even if they had not formalised the terminology.
Today, the challenge is sustainability. Regulatory templates evolve, new products and models are introduced, and architectures are modernised. Trying to maintain the same level of governance and lineage across every attribute in every feed is neither realistic nor effective.
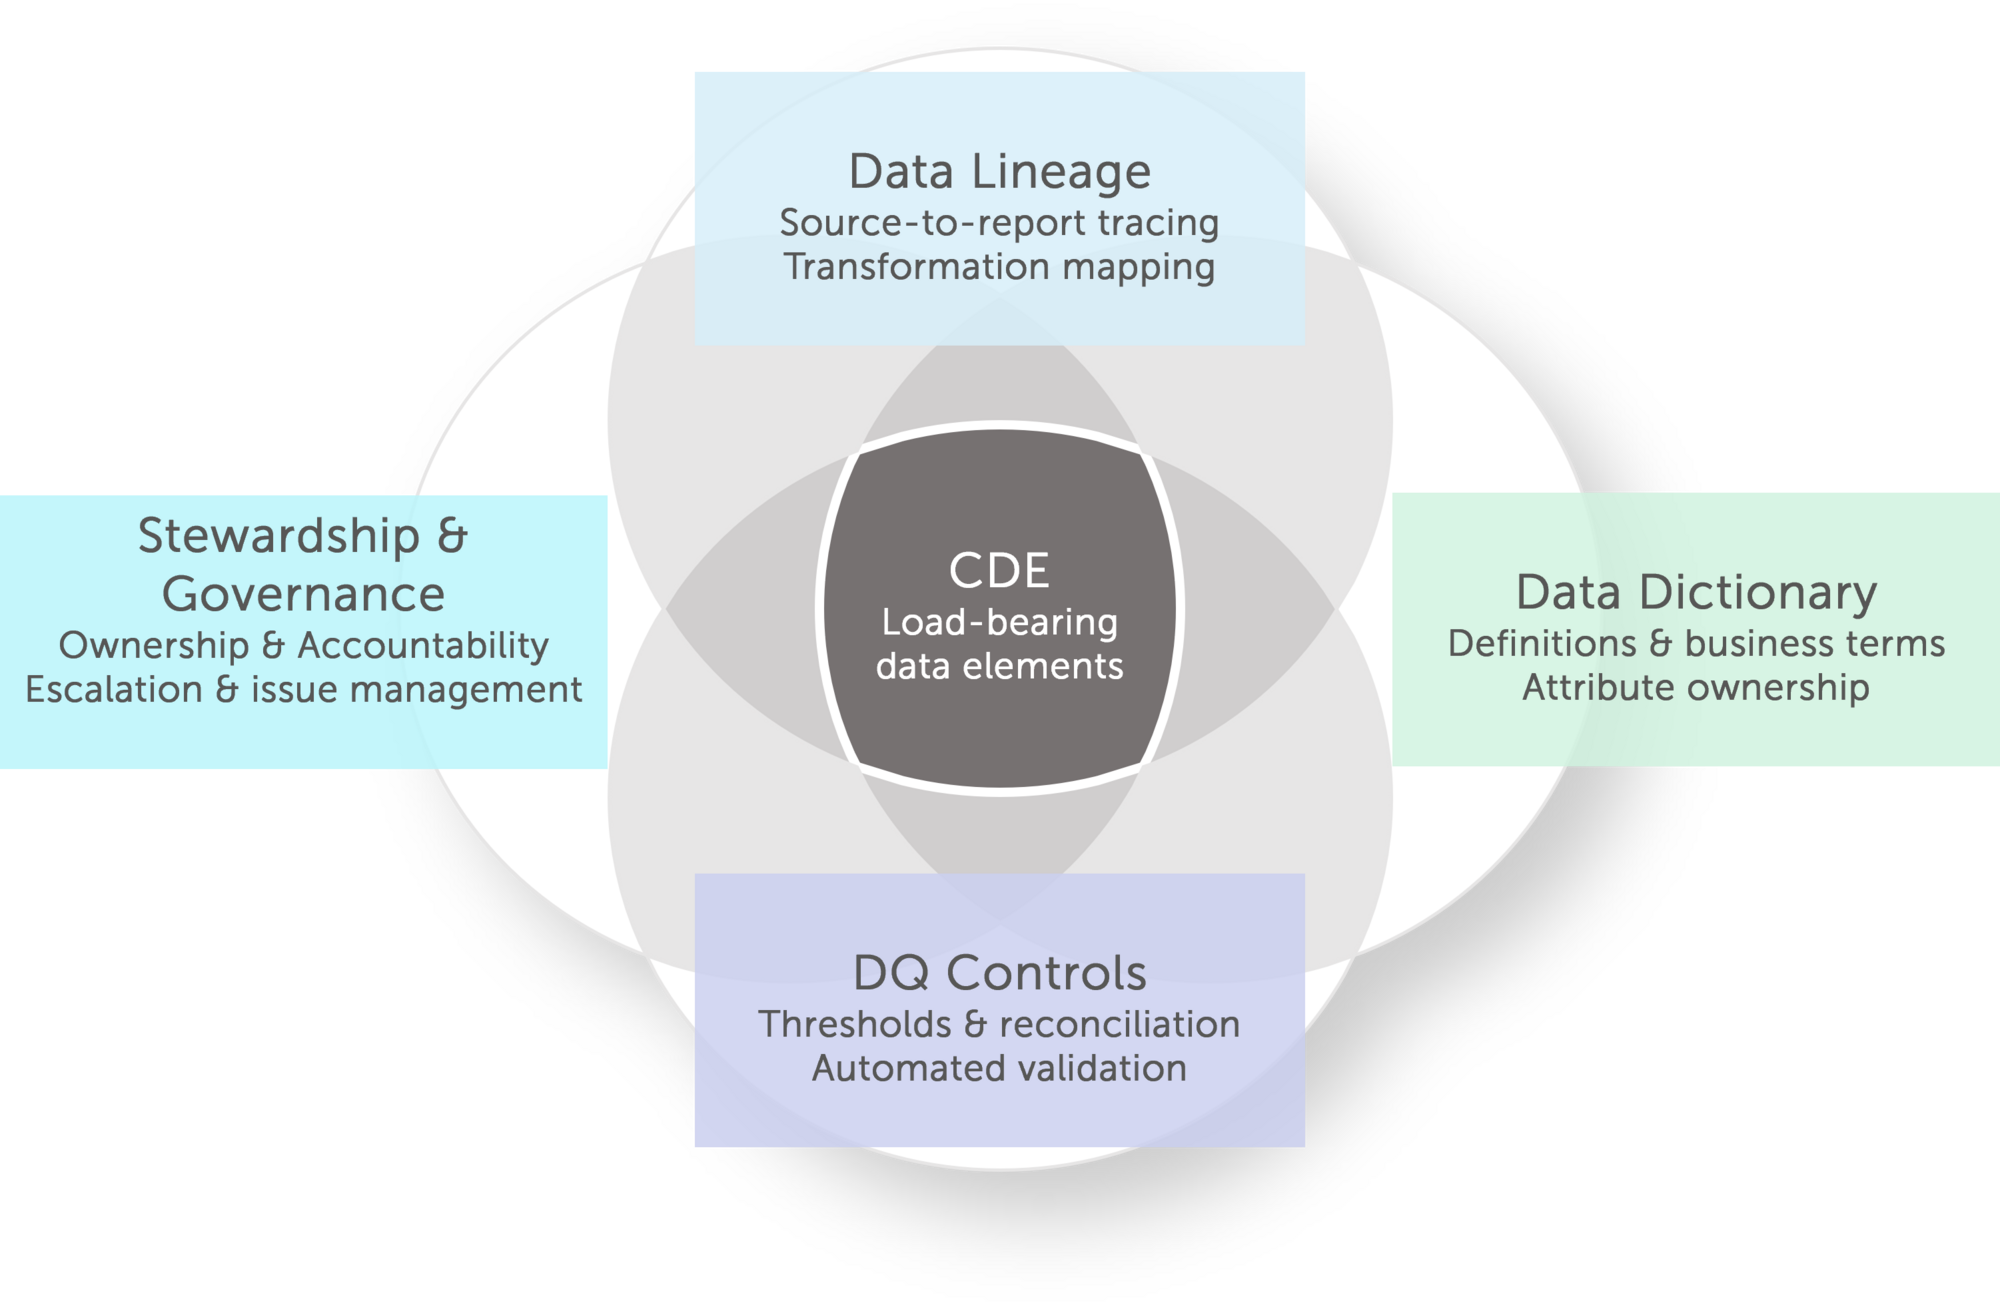
CDEs earn their status through interdependence, not declaration. "Collateral Value" demands a single definition reconciled across Basel IRB LGD, IFRS 9 impairment staging, and LCR outflow calculations -because ambiguity there isn't a documentation gap, it's a capital adequacy gap. A counterparty identifier's path from trade booking to RWA aggregation becomes a priority lineage path not because the technology is complex, but because a break in that chain moves a regulatory capital number. A Probability of Default flagged outside validated model ranges needs immediate escalation - not a daily batch report. These aren't isolated data quality concerns; they are the points where poor governance translates directly into model risk, misstatement, or regulatory censure.
What makes CDEs operationally powerful is that they force each discipline to deliver precisely. Lineage without CDE prioritisation produces comprehensive maps nobody acts on. DQ controls without CDE materiality thresholds generate noise rather than signal. Stewardship without named accountability for specific elements -an identified owner for Exposure at Default, a defined remediation SLA, board-level visibility when thresholds breach- remains a governance policy on paper. CDEs convert each discipline from a programme of record into a working control. That is why they sit at the centre of the diagram: not as an artefact to be catalogued, but as the intersection where definition, traceability, quality, and accountability become mutually reinforcing
This integration creates a virtuous cycle:
The Criticality Challenge
Yet despite this elegant architecture, ambiguity persists: what exactly qualifies as "critical"? Without clear criteria, governance teams face pressure to treat every attribute as equally vital resulting in resource exhaustion and coverage gaps.
Regulatory metrics like RWA, ECL, and LCR decompose to dozens of constituent elements, but only a fraction materially drive outcomes. The temptation to cast the CDE net too broadly undermines proportionality, while casting it too narrowly creates blind spots. This definitional ambiguity pulls everything into the CDE framework by default, diluting focus where it matters most.
Successful BCBS 239 programs recognise that defining "critical" isn't academic, it’s the leverage point determining whether risk data governance delivers demonstrable resilience or remains a documentation exercise.
By the time institutions reach a mature stage in their RDARR programmes, most foundational capabilities are already in place. Data dictionaries have been built, lineage has been documented, and data‑quality controls operate across key COREP, FINREP and liquidity reporting pipelines. The question governance teams now face is much more targeted: out of thousands of attributes, which ones genuinely warrant enhanced CDE‑level oversight?
Regulatory guidance offers an initial anchor. The European Banking Authority defines Critical Data Elements as data used to calculate key risk indicators that have a direct or significant impact on the value of the indicator or on the technical routine of calculation and reporting. On paper, this is clear. In practice, when applied across complex reporting landscapes, it can be disarmingly broad. Most capital, liquidity and financial reporting frameworks rely on large sets of attributes sourced from multiple systems and transformation layers. Many of these influence regulatory metrics in some way. If the definition is interpreted too generously, institutions can quickly find themselves with hundreds or even thousands of “critical” candidates, overwhelming governance capacity.
This is exactly what many banks see in their first CDE identification passes. Once template cells are mapped back through staging layers to source systems, it becomes obvious that a significant share of the dataset contributes, directly or indirectly-to the calculation of metrics such as total RWA, LCR, NSFR or Stage 3 ratios. Without additional guardrails, the CDE universe expands rapidly, making proportional coverage and sustainable control design almost impossible.
Mature RDARR programmes therefore supplement the regulatory definition with a structured CDE evaluation framework: a scoring model that determines whether a data element truly warrants critical classification. The goal is to move beyond the binary question “does this attribute appear in a regulatory calculation?” and instead assess how materially it influences outcomes and how intensively it should be governed.
A practical framework typically evaluates each candidate data element along five dimensions, each with defined weights and scoring logic:
Each dimension is scored from 1 to 5 and combined into a weighted criticality score, typically along the lines of:
CDE Score = 0.35× Regulatory Materiality +0.25 × Impact Sensitivity +0.15× Cross-Domain Reusability +0.15×Control Dependency+0.10×Operational Volatility
Attributes above a calibrated threshold—often resulting in roughly 10–15% of attributes within a given domain—enter the CDE inventory, while the remainder are governed with standard, but less intensive, controls.
Dimension | Weight | Score 1- Low | Score 5 - High | Example |
| Regulatory materiality ( Direct Feed to Regulatory Metric) | 35% | Internal Management use only | Appears firectly in Regulator Template Cell | Credit RWA Exposure |
| Impact sensitivity (Metric movement from variation) | 25% | Descriptive tag or Negligible impact on Metrics | Triggers Limit or Regulatory Breach | Retail Deposit Maturity Bucket |
| Cross-domain reusability (Reuse across domains & metrics) | 15% | Single Report/ Indicator only | Used across Credit , Market and Liquidity Risk | Post Haircut Collateral Value |
| Control dependency (Scores weakness not strength) | 15% | Automated Feed / GL reconciled | Manual, Sampling Checks Only | EUC Defined Attributes |
| Operational volatility (Frequency of attribute change) | 10% | Static — legal entity, incorporation country | High-frequency, cut-off sensitive | Intraday Central Bank Balance |
5 dimensions · scored 1–5 | ||||
Note: These proportional scoring weights are not regulator-prescribed; rather, they represent practitioner-informed benchmarks developed through extensive experience delivering BCBS 239 compliance across banks.
These guardrails turn CDE identification from a one‑off mapping exercise into a repeatable, evidence‑driven process. They prevent uncontrolled expansion of the CDE list, focus enhanced governance on elements that genuinely drive capital and liquidity outcomes, and provide a defensible rationale during supervisory reviews. Most importantly, they reinforce the central theme of BCBS 239: in a world of ever‑growing data, what ultimately matters is not how much you govern, but whether you can prove that you have identified and protected what is truly critical.
The multi-dimensional scoring model produces a single CDE criticality score for each candidate attribute:
Overall Weighted Score=∑(Di×Wi)
where DI = dimension level score, Wi = assigned weight
Worked Example: Collateral Value (Post-Haircut)
| Dimension | Score | Weight | Weighted Score |
| Regulatory Materiality | 5 | 35% | 1,75 |
| Cross-Domain Sensitivity | 5 | 25% | 0,75 |
| Control Dependency | 4 | 15% | 0,6 |
| Operational Volatility | 3 | 10% | 0,3 |
| TOTAL | 100% | 4,65 |
Result: Score 4.65/5 → Tier 1: Top Critical CDE
| Tier | Score | Scoring Characteristics | Governance Efforts | Risk Data Examples |
| Tier 1 High Critical CDEs | ≥ 4.0 | Direct Regulatory Impact | Named Steward | Collateral Value (Post-Haircut) |
| High Sensitivity | Daily DQ Monitoring | Probability of Default (PD) | ||
| Cross-Domain | Automated Lineage | Counterparty Netting Set ID | ||
| Weak Controls | Board Reporting | Forbearance Flag | ||
| Tier 2-Standard CDEs | 3.0–3.9 | Material, Lower Sensitivity | Monthly DQ Review | Product Classification Code |
| Domain-Specific | Documented Lineage | Rate Repricing Date | ||
| Adequate Controls | Owner Accountability | Collateral Type & Eligibility | ||
| Tier 3- Probable Non-CDE Attributes | < 3.0 | Low Impact | Completeness Checks | Legacy System Reference ID |
| Single-Use | Consistency Checks | Branch / Cost Centre Code | ||
| Automated Controls | Annual Review | Internal Portfolio Tag |
This tiered structure delivers BCBS 239 proportionality at scale:
The result: Sustainable RDARR governance that withstands supervisory scrutiny while remaining operationally viable, a true evolution from BCBS 239 compliance to demonstrable risk data resilience. This proportionality exercise also helps in identifying the real Critical Data elements which will be 15 % to 20 % of the total attribute population identified within the domains.
This scoring‑to‑tiering mechanism transforms CDE identification from a static exercise into a dynamic governance engine, continuously recalibrating controls to match evolving regulatory templates, product sets and system architecture.
CDE Identification and associated governance serve as backbone for a successful BCBS239 Implementation. Guard railing the CDE and doing that with proper identified framework gives the programme a clear visibility of where and what to see. With years of experience in helping banks launch
As per the “Guide on effective risk data aggregation and risk reporting” published by the European Central Bank (ECB) in May 2024, critical data elements are those data elements used to calculate key risk indicators and that have a direct or significant impact on the value of the indicator, the technical calculation routines, or the reporting.
Finalyse InsuranceFinalyse offers specialized consulting for insurance and pension sectors, focusing on risk management, actuarial modeling, and regulatory compliance. Their services include Solvency II support, IFRS 17 implementation, and climate risk assessments, ensuring robust frameworks and regulatory alignment for institutions. |

Check out Finalyse Insurance services list that could help your business.
Get to know the people behind our services, feel free to ask them any questions.
Read Finalyse client cases regarding our insurance service offer.
Read Finalyse blog articles regarding our insurance service offer.
Designed to meet regulatory and strategic requirements of the Actuarial and Risk department
Designed to meet regulatory and strategic requirements of the Actuarial and Risk department.
Designed to provide cost-efficient and independent assurance to insurance and reinsurance undertakings
Finalyse BankingFinalyse leverages 35+ years of banking expertise to guide you through regulatory challenges with tailored risk solutions. |

Designed to help your Risk Management (Validation/AI Team) department in complying with EU AI Act regulatory requirements
A tool for banks to validate the implementation of RWA calculations and be better prepared for CRR3 in 2025
In 2027, FRTB will become the European norm for Pillar I market risk. Enhanced reporting requirements will also kick in at the start of the year. Are you on track?
Finalyse ValuationValuing complex products is both costly and demanding, requiring quality data, advanced models, and expert support. Finalyse Valuation Services are tailored to client needs, ensuring transparency and ongoing collaboration. Our experts analyse and reconcile counterparty prices to explain and document any differences. |

Helping clients to reconcile price disputes
Save time reviewing the reports instead of producing them yourself
Helping institutions to cope with reporting-related requirements
Be confident about your derivative values with holistic market data at hand
Finalyse PublicationsDiscover Finalyse writings, written for you by our experienced consultants, read whitepapers, our RegBrief and blog articles to stay ahead of the trends in the Banking, Insurance and Managed Services world |

Finalyse’s take on risk-mitigation techniques and the regulatory requirements that they address
A regularly updated catalogue of key financial policy changes, focusing on risk management, reporting, governance, accounting, and trading
Read Finalyse whitepapers and research materials on trending subjects
About FinalyseOur aim is to support our clients incorporating changes and innovations in valuation, risk and compliance. We share the ambition to contribute to a sustainable and resilient financial system. Facing these extraordinary challenges is what drives us every day. |

Finalyse CareersUnlock your potential with Finalyse: as risk management pioneers with over 35 years of experience, we provide advisory services and empower clients in making informed decisions. Our mission is to support them in adapting to changes and innovations, contributing to a sustainable and resilient financial system. |

Get to know our diverse and multicultural teams, committed to bring new ideas
We combine growing fintech expertise, ownership, and a passion for tailored solutions to make a real impact
Discover our three business lines and the expert teams delivering smart, reliable support