


Gary is a Principal Consultant within our insurance practice in Dublin. He has 16 years of experience within the life and non-life (re)insurance sectors covering industry, audit and consultancy roles. His expertise covers financial reporting, prudential and conduct risk management, and assurance activities. Gary has provided outsourced actuarial, risk, compliance, and internal audit function services for a wider range of insurers, reinsurers and captives.
Peer Reviewed by Francis Furey, Principal Consultant – Finalyse Dublin
What is an appropriate Solvency Capital Requirement (‘SCR’) target ratio? It’s a question we have heard many times since the introduction of Solvency II in 2016. Yet, many boards and management groups still grapple with the problem. The short answer? It depends on each (re)insurer's own circumstances and risk appetite. There is no blanket approach. Practices vary widely, although there has recently been some convergence across the industry toward a middle ground.
In this article, we reflect on recent trends and factors that insurers should consider—and document—when setting their SCR target ratio.
There is no one-size-fits-all answer, but no one wants to stand out too much from the crowd. Maintaining an SCR ratio significantly below your peer group’s average may invite regulatory scrutiny.
At the end of 2023, Irish-domiciled insurers reported a median SCR ratio of 196%. In other words, half held SCR ratios above this level and half below. Remarkably, this threshold has remained steady since 2017. Of greater interest, however, is the narrowing deviation around the median.
Holding a 100% SCR ratio is technically compliant, though nearly all insurers opt to maintain a buffer well above the regulatory minimum. In 2018, 19 out of 20 insurers reported an SCR ratio greater than 121%. By 2023, 19 out of 20 held ratios above 139% as higher capital cushions became the norm. Insurers maintaining a ratio below this level may be justified, but would be well advised to document a compelling rationale for their position.
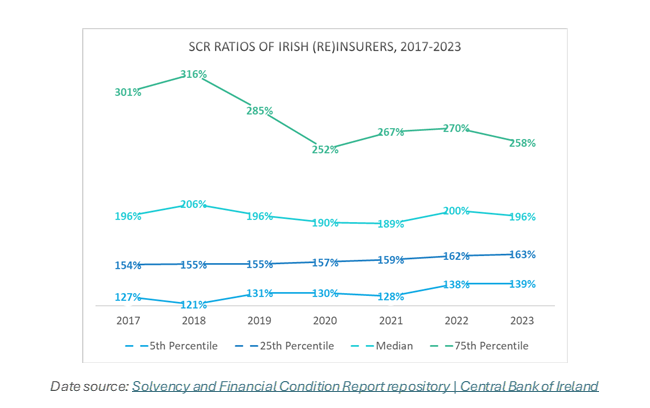
Interestingly, the 25th percentile has increased from 154% coverage in 2017 to 163% in 2023. In other words, three out of four insurers now hold more than 1.63 times their SCR.
And while flirting with low SCR ratios has become less common, we’ve also seen a shift away from the other extreme — fewer insurers are opting to maintain very high capital levels. In 2018, one in four insurers reported coverage ratios exceeding 316%. By the end of 2023, this figure had dropped sharply to 258% — a decline accelerated by the pandemic.
In summary, while practices remain diverse, Irish insurers appear to be converging closer to a common middle ground.
Most risk appetite statements reference point-in-time SCR coverage, but only higher quality statements assess the future outlook. This assessment is particularly relevant for growing insurers that plan to “eat up” more capital as premium volumes expand.
Leading insurers are moving away from static point-in-time metrics toward forward looking SCR ratios. Emerging best practice links risk appetite metrics with the firm’s ORSA time horizon.
How can one insurer set a risk appetite limit at 120% while another with a similar profile opts for 160%? Surely, one must be wrong? — No, not necessarily.
Before setting a risk appetite limit, it’s standard practice to brainstorm, assess, and quantify a wide range of severe but plausible stresses, shocks, and scenarios—often as part of the ORSA process.
The adequacy of reinsurance mitigation plays a major role here. Many low-complexity captive insurers in the Irish market write business with low policy limits and stop-loss reinsurance thresholds. For these insurers, extreme disaster scenarios might only result in modest SCR ratio deteriorations.
Most insurers have reasonably well-developed ORSA stress and shock tests, though some still fail to fully challenge the effectiveness of reinsurance arrangements under market-wide stress conditions — an area where regulators have called for greater professional scepticism.
For more complex insurers, large policy limits, high reinsurance thresholds, or looser asset-liability matching policies can create exposure to significant risks. Higher SCR target ratios may be merited in such cases.
While it’s tempting to distil considerations into a single number and benchmark against peers, a strong risk framework should include robust documentation supporting chosen risk limits.
Insurers prone to quarter-to-quarter SCR volatility will naturally target higher SCR ratios.
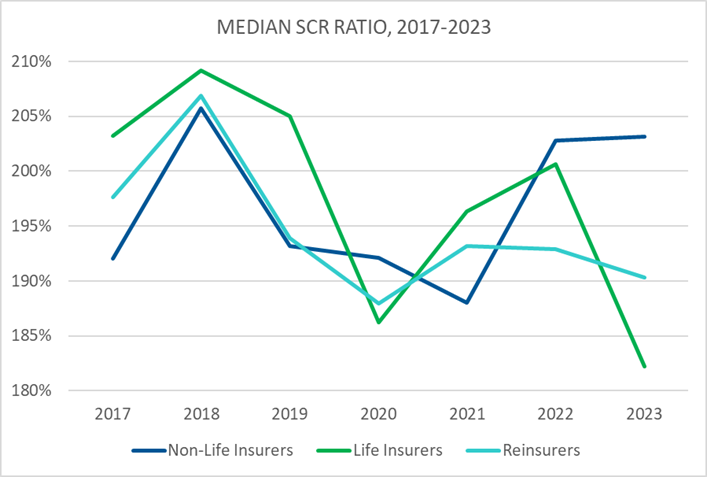
Our analysis of median SCR ratios by undertaking type provided some interesting insight. Life insurers maintained higher ratios, compared to non-life insurers and reinsurers, from 2017 to 2019 — a period of economic stability. However, life insurers proved the most vulnerable subgroup during the COVID-19 pandemic in 2020, and to interest rate volatility from 2021 to 2023.
Between 2022 and 2023, the median SCR ratio for life insurers fell by 19 percentage points, while non-life insurers and reinsurers exhibited greater stability.
To understand inherent volatility, insurers should consider sensitivity testing against a broad range of risks. This may include interest rates, investments, options and guarantees, counterparty exposures, and underwriting risks. Establishing links between SCR target ratios and capital sensitivity risks outlined in the risk register is a must.
How much capital is too much? It’s not a bad problem to have! Though for some insurers, capital optimisation remains a challenge.
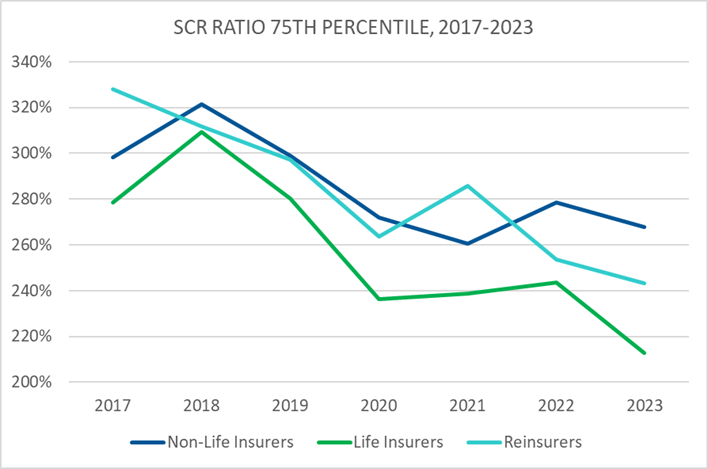
Since Solvency II’s introduction, some undertakings have consistently held enough capital to meet their SCR several times over. Strategic reasons for doing so vary. For example, reinsurers and non-life insurers often build up buffers in anticipation of growth. In 2018, one in four reinsurers reported SCR ratios above 328%. Similarly, one in four non-life insurers exceeded 321% in 2019. Much of this capital was subsequently deployed as these (re)insurers exploited opportunities post-Brexit.
Life insurers, whose capital needs are predominantly driven by back-book business, have fewer opportunities for dramatic portfolio growth. The SCR of life insurers also tends to be much higher than other undertaking types. As such, holding many multiples of the SCR would be a more demanding capital ask.
Some insurers still continue to hold plenty excess capital, but not to the extent observed pre-pandemic. Rising interest rates and costs of capital has increased scrutiny from shareholders on how insurers optimise capital, discouraging excessive capitalisation levels in some cases.
Financial support from groups and the fluidity of capital across group entities are critical considerations in setting SCR target ratios. Insurers with the lowest SCR ratios often rely heavily on strong group support. As Solvency II has matured, regulators have placed greater scrutiny on the credibility of assumed management actions in the ORSA, particularly around capital injections.
Homing in on reinsurers in the Irish market, most fall into two categories: small captives reinsuring group risks or larger reinsurers that are part of well-capitalised international groups. These reinsurers have grown increasingly comfortable relying on group support to mitigate an SCR breach. In 2018, 1-in-20 reinsurers allowed their SCR ratio to fall below 134%. By 2023, this figure had dropped to 121%.
Conversely, end-consumer facing non-life insurers have trended toward higher local capital retention. This is possibly due to barriers faced in accessing group funds quickly enough during a crisis.
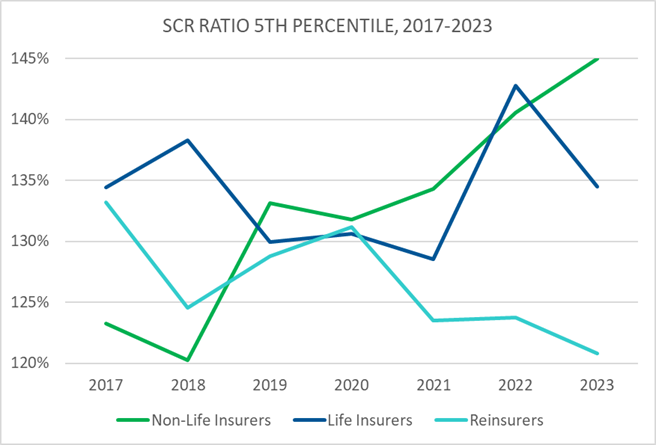
For life insurers, we observed that very few entities allow their SCR ratios to dip below 130%.
Leading practice insurers support their SCR targets with documented assessments of group strength under both normal and stressed conditions. This approach has become more prevalent since the introduction of pre-emptive recovery planning.
Larger domestic insurers, or those with significant international operations, often seek credit ratings to enhance policyholder assurance, investor confidence, and reinsurance terms. Higher ratings can also open doors to greater new business opportunities. To achieve this, many large insurers strategically hold surplus capital, viewing a strong credit rating as a worthwhile trade-off for capital allocated.
For smaller, unrated insurers, the benefits of holding excess capital are less pronounced. Consequently, SCR ratio benchmarking between rated and unrated insurers should be approached with caution.
Insurers using Solvency II’s Standard Formula must assess whether their risk profile aligns with the formula’s underpinning assumptions. Those with atypical risk profiles or who feel the Standard Formula understates their risks often require higher SCR targets. Conversely, insurers with robust assessments showing close alignment with the formula may be more comfortable targeting lower ratios.
Recent trends have seen best-in-class insurers reflecting both the Standard Formula and own solvency needs assessment in their risk appetite statements.
Internal model users, by definition, have capital models more closely tailored to their risk profiles than the Standard Formula.
Determining an appropriate SCR target ratio requires careful consideration of an insurer’s unique circumstances, peer practices, and risk appetite. By addressing these eight considerations, insurers can establish SCR targets that not only align with regulatory expectations and strategic objectives but also strengthen resilience and competitive positioning in the market.
To support this process, we have developed a capital optimisation tool to help insurers analyse, model, and refine their SCR strategies. The tool has been developed to provide actionable insights and improve decision-making. For further support or to request a demo, get in touch with Gary Stakem, Francis Furey, or your regular Finalyse contact.
An SCR target ratio is the level of Solvency Capital Requirement coverage an insurer aims to maintain above the regulatory minimum. It reflects the firm's risk appetite, capital strategy, growth plans and financial resilience. Most insurers set an internal target above 100% to provide a buffer against unexpected market or underwriting shocks.
Insurers determine an SCR target ratio by considering their risk profile, ORSA results, capital volatility, peer benchmarking, reinsurance arrangements, group support and strategic objectives. Rather than applying a standard percentage, firms should document how their chosen target aligns with their risk appetite and long-term capital management strategy.
Peer benchmarking helps insurers understand how their SCR target compares with similar firms and supports discussions with boards and regulators. While every insurer's circumstances differ, maintaining a significantly lower capital buffer than comparable firms may require additional justification through the ORSA and risk appetite framework.
Finalyse InsuranceFinalyse offers specialized consulting for insurance and pension sectors, focusing on risk management, actuarial modeling, and regulatory compliance. Their services include Solvency II support, IFRS 17 implementation, and climate risk assessments, ensuring robust frameworks and regulatory alignment for institutions. |

Check out Finalyse Insurance services list that could help your business.
Get to know the people behind our services, feel free to ask them any questions.
Read Finalyse client cases regarding our insurance service offer.
Read Finalyse blog articles regarding our insurance service offer.
Designed to meet regulatory and strategic requirements of the Actuarial and Risk department
Designed to meet regulatory and strategic requirements of the Actuarial and Risk department.
Designed to provide cost-efficient and independent assurance to insurance and reinsurance undertakings
Finalyse BankingFinalyse leverages 35+ years of banking expertise to guide you through regulatory challenges with tailored risk solutions. |

Designed to help your Risk Management (Validation/AI Team) department in complying with EU AI Act regulatory requirements
A tool for banks to validate the implementation of RWA calculations and be better prepared for CRR3 in 2025
In 2027, FRTB will become the European norm for Pillar I market risk. Enhanced reporting requirements will also kick in at the start of the year. Are you on track?
Finalyse ValuationValuing complex products is both costly and demanding, requiring quality data, advanced models, and expert support. Finalyse Valuation Services are tailored to client needs, ensuring transparency and ongoing collaboration. Our experts analyse and reconcile counterparty prices to explain and document any differences. |

Helping clients to reconcile price disputes
Save time reviewing the reports instead of producing them yourself
Helping institutions to cope with reporting-related requirements
Be confident about your derivative values with holistic market data at hand
Finalyse PublicationsDiscover Finalyse writings, written for you by our experienced consultants, read whitepapers, our RegBrief and blog articles to stay ahead of the trends in the Banking, Insurance and Managed Services world |

Finalyse’s take on risk-mitigation techniques and the regulatory requirements that they address
A regularly updated catalogue of key financial policy changes, focusing on risk management, reporting, governance, accounting, and trading
Read Finalyse whitepapers and research materials on trending subjects
About FinalyseOur aim is to support our clients incorporating changes and innovations in valuation, risk and compliance. We share the ambition to contribute to a sustainable and resilient financial system. Facing these extraordinary challenges is what drives us every day. |

Finalyse CareersUnlock your potential with Finalyse: as risk management pioneers with over 35 years of experience, we provide advisory services and empower clients in making informed decisions. Our mission is to support them in adapting to changes and innovations, contributing to a sustainable and resilient financial system. |

Get to know our diverse and multicultural teams, committed to bring new ideas
We combine growing fintech expertise, ownership, and a passion for tailored solutions to make a real impact
Discover our three business lines and the expert teams delivering smart, reliable support