The regulatory landscape for IRRBB is rapidly changing. Are you up to date?
In 2027, FRTB will become the European norm for Pillar I market risk. Enhanced reporting requirements will also kick in at the start of the year. Are you on track?
Are you ready for the next regulatory stress test? Are you aware of all your risks – particularly the tail risks?
On 12th December 2023, the Basel Committee on Banking Supervision (“BCBS”) issued a public consultation (“the paper”) titled ‘Recalibration of shocks for interest rate risk in the banking book’, for comment by 28 March 2024.
The current standards, published in April 2016, are intended to safeguard against the risk to bank’s capital and earnings from interest-dependant products. This was achieved through the application of global shock parameters to bank’s economic value and net interest income projections.
While the current standards already highlight the need for periodic recalibration of the shocks applied, the turmoil in Banking experienced in March 2023 has brought the effectiveness of the standards into sharp focus. The rapid increase in interest rates, beginning in Q3 2022 and peaking in Q3 2023, left many banks with a maturity mismatch between long-term investments made in a low interest rate environment and demand for increased deposit rates. While European markets remained relatively stable throughout the period, the impacts were greater in the US with two banks - Silicon Valley Bank and Signature Bank - closing.
While the BCBS confirmed that a periodic calibration review was already underway at the time of the recent turmoil, these events have brought additional focus on the exercise.
The current calibration methodology uses the product of global shock parameters and average interest rates across currencies and applies floors, caps and rounding to the results.
| Scenario | Combination of Tenors | Global Shock Parameters |
| Short | 3M, 6M, 1Y | 85% |
| Parallel | 2Y, 5Y, 7Y | 60% |
| Long | 10Y, 15Y, 20Y | 40% |
Table 1: Scenario Tenors and Shocks
- The floors, caps and rounding applied are shown in Table 2 below.
| Measure | Value (bps) |
| Floor | 100 |
| Cap – Short | 500 |
| Cap – Parallel | 400 |
| Cap – Long | 300 |
| Rounding | (nearest) 50 |
Table 2: Floors, Caps & Rounding
While the current methodology produces reasonable results for the original time series, many markets have experienced interest rates close to, if not equal to, 0% in recent years. This resulted in an issue during the recalibration exercise when the time series was extended to cover the total period from January 2000 – January 2022.
As the current methodology for calculating shock parameters uses a series based off relative change in interest rates, small movements in rates can produce huge relative changes in a low interest rate environment, leading to unrealistic time series and the overapplication of caps which bring into question the validity of the standard.
To solve this issue, the BCBS have proposed the following changes:
These would be incorporated into a new methodology which records absolute change in interest rates instead of relative change when producing the time series. For each scenario and currency, the average of the absolute rate changes across the corresponding time buckets (allocation in Table 1 remains unchanged) would then be calculated and used to produce a new series, from which the absolute value of the 99.9th percentile of each series would be used as the interest rate shock for each combination of scenario and currency i.e. local shock parameters.
It should be noted that the methodologies used for calculating average historical interest rates, as well as the application of floors, caps and rounding would remain unchanged.
Using the tables provided in the paper, we have performed a high-level impact assessment of the changes proposed.
The paper does not include any information which could be used to accurately assess the impact of the extended data series on the shocks produced by the existing methodology. This is likely due to the problems encountered by the current methodology when capturing interest rate changes during periods when rates are close to zero. Therefore, any comparison between the data series using the old methodology alone would likely be nonsensical. As a result, observations concerning the impact of the extended data series on results will be made in line with other factors.
Using tables 6 and 8 from the paper, represented by Tables 3 and 4 below, we can compare the impact of the change in percentile for two output tables using the new methodology and extended data series. As expected, a large proportion, c.57%, of the shocks increase, with an average increase of 134bps across all scenarios. As expected, there are no decreases resulting from the proposed percentile change.

Table 3: Proposed Methodology, 99.9th percentile, extended dataset 2000–2022

Table 4: Proposed Methodology, 99th percentile, extended dataset 2000–2022
However, while the increase in percentile used will obviously reflect increased conservatism, these results (Table 3) should also be compared against the results of the existing approach, shown in table 1 of the paper and represented by Table 5 below. When comparing the shocks in Table 3 (using the new calibration methodology, extended data series and increased percentile) against the existing shocks in Table 5, the impact is significantly reduced, with only c.41% of shocks increasing and c.13% decreasing. This is a reduction of 16% in the number of shocks which increase. Of the shocks affected, the average increase is 205bps, while the average decrease is c.88bps.

Table 5: Current Methodology, 99th percentile, original dataset 2000-2015
While an increase in the percentile will increase conservatism, without a table demonstrating the impact of the proposed percentile change with all other factors remaining constant i.e. using the current calibration approach and data series, it is unclear how much of an impact this change actually has on the final shock parameters.
Based off the output tables provided by the BCBS in the paper, the best approach to assess the revised calibration methodology is by comparing tables 1 and 7 of the paper, represented here by Table 5 and Table 6 respectively. Table 5 (above) reflects the shock parameters arrived at using the current approach, while Table 6 (below) uses the proposed methodology (including percentile change) applied to the original data series. By comparing output tables using the same input data series, we can assess the level of additional conservatism associated with the new methodology.
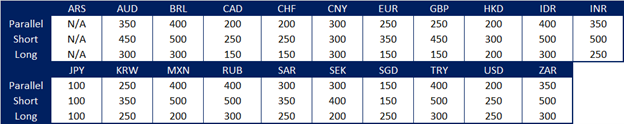
Table 6: Proposed Methodology, 99.9th percentile, original dataset 2000-2015
Similar to the observations made earlier when comparing the impact of the percentile change against current shocks, we see an increase in c.37% of shocks and decrease in c.15% of shocks, with almost 50% remaining unchanged. Across all scenarios, the average increase in shocks is 175bp, with an average decrease of 70bp.
While almost half of the shocks remain unchanged, the proposed changes to methodology and percentile lead to increases in over a third of the shocks, suggesting additional conservatism in the proposed methodology.
It is worth noting that the impacts seen in the previous comparison between the proposed methodology with extended dataset against the current shocks are only slightly greater in impact i.e. c.41% of shocks increase instead of c.37% and c.13% decrease instead of c.15%. Similarly, the average increase experienced is 205bps compared to 175bps, while the average decrease is c.88bps instead of 70bps. This implies that the increase in shocks is primarily driven by the change in methodology, with the extension of the dataset having a much smaller impact on results.
The consultation paper also discusses the impact of the caps applied to the interest rate shocks and proposes the following addition to the standard:
“Supervisors may, applying national discretion, set a higher floor under the local interest rate shock scenarios for their home currency, or a higher cap, resulting in more conservative shocks. […]”
Tables 7 and 8 below, representing tables 4 and 9 from the paper, present the uncapped shocks produced using the current and revised methodologies. A legend has also been provided to explain the colour coding applied.
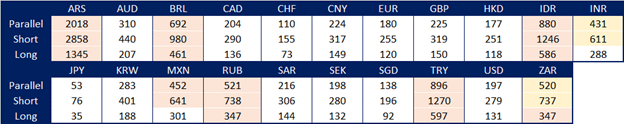
Table 7: Current Methodology, 99th percentile, original dataset 2000-2015: Caps
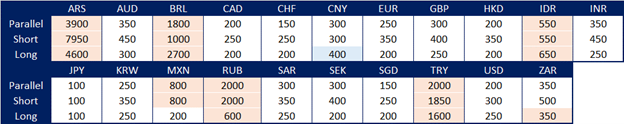
Table 8: Proposed Methodology, 99.9th percentile, extended dataset 2000–2022: Caps

As can be seen from the above tables, 18 shocks are capped in both methodologies, while totals of 22 and 19 shocks are capped overall in Tables 7 and 8, representing the current and proposed methodology respectively.
Across all scenarios, the average decrease in shocks resulting from the cap using the current methodology is 464bps, while the corresponding figure is 1,505bps for the proposed methodology, after applying rounding. However, it must be noted that in both cases, the largest 4 capped currencies are responsible for 89% and 95% of the overall decrease in shocks for each methodology, respectively. Moreover, 3 of the 4 currencies are the same for both methodologies, i.e. ARS, BRL, and TRY, suggesting that the influence of the caps is concentrated on a small number of currencies.
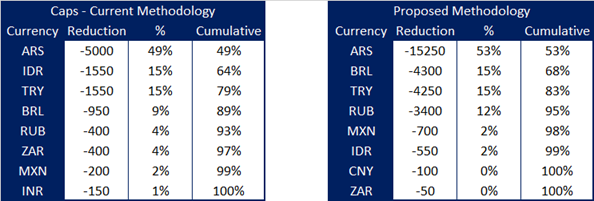
Table 9: Influence of caps across all scenarios
This suggests that the additional flexibility permitted to regulators by the proposed change may be sufficient to curb the over influence of the cap.
As part of the recalibration exercise, the committee is also reviewing the impact of the proposed new methodology on scenarios where banks are required to apply non-parallel shocks. These include the short up, short down, steepened and flattener scenarios. It is yet to be concluded whether the proposed change in methodology would require any update to the formulas used.
As part of this consultation exercise, a quantitative impact assessment of the revised calibration of the shocks factors and updated methodology will be undertaken using data collected from banks. The results will feed into the final version of the updated standard.
While existing standards ensured European banks were able to navigate through the recent turmoil, questions remain over the stability of banks in some other jurisdictions during such periods of stress. As such, the extension of the input data series for shock calibration and discussion over the application of the cap is welcome.
While additional data would be welcomed to complete a more granular impact analysis, a high-level review suggests that the proposed methodology changes and extension of the input dataset will result in additional conservatism for most currencies, with local shock parameters introduced to reflect currency fluctuations more accurately than global parameters. Despite this added conservatism, shocks will remain consistent for most currencies.
The introduction of more flexibility in the application of the cap for supervisors is a welcome change and reflects the concentrated nature of the application of the cap.
Finally, we welcome the results of the quantitative impact assessment using real data collected from banks and the opportunities for further analysis that it will bring.
Finalyse InsuranceFinalyse offers specialized consulting for insurance and pension sectors, focusing on risk management, actuarial modeling, and regulatory compliance. Their services include Solvency II support, IFRS 17 implementation, and climate risk assessments, ensuring robust frameworks and regulatory alignment for institutions. |

Check out Finalyse Insurance services list that could help your business.
Get to know the people behind our services, feel free to ask them any questions.
Read Finalyse client cases regarding our insurance service offer.
Read Finalyse blog articles regarding our insurance service offer.
Designed to meet regulatory and strategic requirements of the Actuarial and Risk department
Designed to meet regulatory and strategic requirements of the Actuarial and Risk department.
Designed to provide cost-efficient and independent assurance to insurance and reinsurance undertakings
Finalyse BankingFinalyse leverages 35+ years of banking expertise to guide you through regulatory challenges with tailored risk solutions. |

Designed to help your Risk Management (Validation/AI Team) department in complying with EU AI Act regulatory requirements
A tool for banks to validate the implementation of RWA calculations and be better prepared for CRR3 in 2025
In 2027, FRTB will become the European norm for Pillar I market risk. Enhanced reporting requirements will also kick in at the start of the year. Are you on track?
Finalyse ValuationValuing complex products is both costly and demanding, requiring quality data, advanced models, and expert support. Finalyse Valuation Services are tailored to client needs, ensuring transparency and ongoing collaboration. Our experts analyse and reconcile counterparty prices to explain and document any differences. |

Helping clients to reconcile price disputes
Save time reviewing the reports instead of producing them yourself
Helping institutions to cope with reporting-related requirements
Be confident about your derivative values with holistic market data at hand
Finalyse PublicationsDiscover Finalyse writings, written for you by our experienced consultants, read whitepapers, our RegBrief and blog articles to stay ahead of the trends in the Banking, Insurance and Managed Services world |

Finalyse’s take on risk-mitigation techniques and the regulatory requirements that they address
A regularly updated catalogue of key financial policy changes, focusing on risk management, reporting, governance, accounting, and trading
Read Finalyse whitepapers and research materials on trending subjects
About FinalyseOur aim is to support our clients incorporating changes and innovations in valuation, risk and compliance. We share the ambition to contribute to a sustainable and resilient financial system. Facing these extraordinary challenges is what drives us every day. |

Finalyse CareersUnlock your potential with Finalyse: as risk management pioneers with over 35 years of experience, we provide advisory services and empower clients in making informed decisions. Our mission is to support them in adapting to changes and innovations, contributing to a sustainable and resilient financial system. |

Get to know our diverse and multicultural teams, committed to bring new ideas
We combine growing fintech expertise, ownership, and a passion for tailored solutions to make a real impact
Discover our three business lines and the expert teams delivering smart, reliable support