

Written by Can Yilmazer, Consultant
Data quality is essential for meaningful model development for credit risk, data management, and data governance.
In Credit Risk, internal rating systems and risk on the current exposures should be measured over high-quality and homogeneous data. Institutions should conduct detailed data quality tests to ensure continuously reliable data quality. Only then can they expect the correct model development.
This article discusses the main steps of data preparation, which determine the required fields/attributes that represent the baseline for model development where relevant data quality controls are applied. It will also discuss the ability to collect, analyse and integrate data requirements.
Before beginning data construction, the model developers should clarify the goals together with the model user/owner.
Even thought the IT department usually implements Data Sources and Data Construction processes, the model developers should insist on verifying the key aspects listed below.
Data Sources
Data Construction
Arguably, the most critical elements for model development are data quality and standardisation. Data formats must be standardised to achieve consistent homogeneous data quality.
Good data quality ensures that model inputs are reasonably reliable and valid. Data modeller can apply a series of checks: correction, refining of missing values, and a collection of data from multiple sources and different data sources into one global database with a standardised data format.
These are data quality dimensions:
Dimensions | Activity | Tests |
Accuracy | Validate whether the input data is as accurate as expected. The data should be substantively error-free. | Moments (mean, standard deviation), quantile statistics (min, max, median), other measures (range, frequency) |
Completeness | The values should be present in the attributes that require them. | Quantifying the number, amount, and percentage of missing values |
Timeliness | Validate that the data is up-to-date. |
|
Consistency | To understand whether a given set of data can be matched across different data sources of the institution. | Cross checks between the current and previous validation datasets |
Uniqueness | The aggregation of data that is free from any duplication given by filters or other transformations of source data. | Percentage of unique identifier linked to over one obligor/facility/account |
Validity | To see if the data is founded on an adequate system of classification, rigorous enough to compel acceptance. | Logical tests based on risk drivers and rating domains |
Traceability | The history, processing, and location of data can be traced. |
Article 73 in Commission Delegated Regulation (EU) 2022/439 states that: "the data should be substantively error-free."
Thus, the data modeller should validate the input data's accuracy, with a specal attention to the general statistics and distribution analysis of obligors/facilities, such as the domains' mean, median, mode, standard deviation, range, and frequency, are applied to the respective fields. E.g., outstanding, limit, exposure, turnover, arrears days and arrears amount, rating, and so on. Besides, one should verify that the range aligns with expectations for the relevant portfolio.
Another critical dimension is data completeness. All values should be present in the attributes that require them.
Quantifying the number, amount, and percentage of missing values over time of domains such as obligors/facilities, default flag, risk drivers, and rating is crucial. The reason for missingness should also be investigated when deciding on the treatment. Sometimes the values can be missing for a specific record (e.g., technical errors, different data entry methods) or for a period of time (e.g., the source system did not exist or was down, or the data was not saved/lost for a period).
The recency of the data is called data timeliness. It is vital to ensure that the data includes present-day values, possibly from a particular period (e.g., the end of the month can mean midnight on the last day of the month, but there can be other definitions, and sometimes 2-3 days discrepancy is acceptable). This also means that timeliness refers to the latest snapshot and all the database snapshots.
Risk driver and rating-related fields are the two main domains to check for timeliness. What qualifies as “up to date” may vary between risk drivers, but a typical update is required annually, quarterly, monthly, weekly, or daily. Also, the number and percentage of outdated ratings over time should be analysed. In general terms, it is also essential to check whether the data delivery system causes any delays.
Consistency checks are made to understand whether a given set of data can be matched across different data sources of the institution.
As in other dimensions, the significant domains for the consistency dimension are obligor/facility, default flag, risk drivers, cashflows, balances, overdue amounts, and rating. Specifically – in an IRB modelling context - consistency checks should be done between Probability of Default(PD), Loss Given Default(LGD), Exposure at Default(EAD) datasets regarding obligors/facilities or a number of defaults. A comparison should also be made with the statistical distribution of risk drivers and ratings between the current and previous validation datasets over the same time period.
Uniqueness represents data aggregation free from any duplication arising from other transformations of source data. Having obligor/facility identifiers duplicate can lead to erroneous results. Therefore, ensuring that the unique identifier is truly unique is necessary. The percentage of facilities linked to more than one customer and customers with one versus double facilities should be checked.
Validity tests allow to see if the data is based on an adequate classification system and is rigorous enough to compel acceptance. In essence, the analysis of erroneous values and outliers should be done for domains such as risk factors and default flags used in the model. These erroneous values are: arrears amount or days expressed in non-numeric or negative, default flag not 0 or 1, and rating number not defined by the model or, e.g., defectively large recovery amounts specified the exposure at default, etc.
Furthermore, possible technical errors in how a variable is populated should be checked. It is necessary to note whether values are expected to be only numeric/character, or if mixing is allowed in this context, and whether there is a predetermined set of valid values (e.g., list of countries, zip codes). Besides, are there any “natural” limits to numeric variables (e.g., age should not be negative or larger than 200)? If there may be a deterioration in the set of values used over time (e.g., the value should be in the same currency over time, if expressed in thousands or millions, that should also be consistent), statistical tests can be used.
With traceability, the history, processing, and location of data under consideration can be easily determined. In particular, validating the standards for the calibration segments' characteristics and verifying the risk drivers used for risk differentiation are illustrations of traceability. Also, a unique identifier number should be traced after changes over time, such as restructuring-related, or etc.
The data used in development of credit risk models (for borrowers or exposures or capital requirement modelling purposes) should represent the portfolio covered by the applicable model. The Population Stability Index(PSI) is the most widely used representativeness test. PSI is a test that measures the difference in the distribution of a variable’s values between two samples or over time. It is used to identify potential problems in model performance and to monitor changes in the characteristics of a population.
Why data must be representative?
It is a fundamental assumption of predictive modelling that the population the model is applied to is similar to the one on which the model was developed. Otherwise, the model predictions are expected to be less reliable.
Factors such as the global economic crisis, data integration issues, coding errors, and changes in internal policies and processes can cause the input data from one period to diverge significantly from input data from other periods in the modelling dataset and from the current and future population to which the model will be applied. All this may result in misleading model predictions.
Out-of-time validation compares the recent and development samples to test for representativeness. PSI is used for each final model variable to calculate a statistic for the difference in the distributions. PSI can also test differences in the final score band or rating distributions.
Population Stability Index Formula:
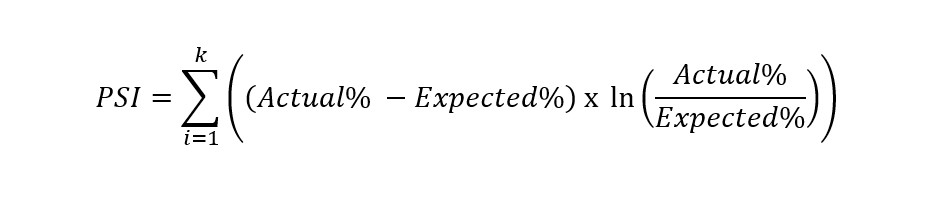
If a risk factor distribution between the development and out-of-time validation sample dataset is similar, such risk driver is representative. The shifts can be checked in the distribution from the following threshold ranges (these thresholds may vary from bank to bank).
PSI Value | Estimate |
<0.1 | Slight |
0.1-0.2 | Minor |
>0.2 | Significant |
Let's suppose that the mentioned dimension tests above detect errors in the data. In that case, the model developer may find it appropriate to apply treatments to the original values to counteract the impact of errors. Institutions need to apply various transformations to deal with problems, such as erroneous and missing data and treatment of outliers. These transformations can be applied with some common treatments for completeness, uniqueness, and accuracy tests.
Working with missing observations is a sensitive topic because the missing type and pattern characteristics need cautious checking. Therefore, missing treatment should clearly define the distinction between 'meaningful missing data' (e.g., the value of the collateral if there is no collateral) or 'technical missing data' (e.g., lack of information on the customer's application) and follow a reasonable and conservative approach. This way, results, such as low discriminatory power and biased predictions, are also prevented.
Missing data values are usually split into two categories:
In some cases, the reason behind the missing data of a facility or an obligor is known; in this case, it is necessary to treat it differently because these values are interpretable and are called ‘meaningful missing values’.
In other cases, the data is truly missing and represents nothing. Examples are technical error during data merges, not filling the information in the application form, privacy reasons, etc. These missing values are called ‘technical missing data'.
There are different treatments for 'meaningful missing values' and 'technical missing data,' but such a level of detail is out of the scope of this article. If a high proportion of 'technical missing data' is present in the dataset – and it is not limited to specific periods in time – the variable would not be considered as a risk driver. Institutions should help the cooperation of modellers and validators by specifying unacceptable levels of this ratio. Financial institutions should have thoroughly considered and decided what kind of treatment will be applied.
The governance of missing values is challenging. Treating these records should be approached with care. To give an example, it is necessary to provide justifications when the modeller decides to remove the data completely. Also, ratio risk drivers must be defined with attention since they are based on a numerator divided by a denominator. For instance, what happens when the denominator equals zero must be specified. It should also be ensured that the missing values are not recorded as zero. Imputation(replacement) can also be a method to deal with missing data. Using known values of risk factors to replace missing values with mean or median values is another method.
Finding outliers is part of the data quality checks. It is vital to determine whether these outliers are data errors or uncommon considerations. Invalid observations can be related to data collection or preparation errors (e.g., calculating 200 years of age from an erroneous date of birth). Valid observations can be actual but rare cases in the data, obligor with an extremely high limit can be an example.
Outliers can be identified during exploratory data analysis (EDA) by visual (e.g., histogram, box, and whiskers plot) and numerical methods (e.g., standard deviation). Using the histogram, we can easily see the distribution of a variable. Besides, institutions may set specific guidelines outside which the observation is considered an outlier (e.g., mean +/- n*standard deviation) - if the variable is normally distributed.
Detected outliers should be treated if they are confirmed as input data errors, and the specific treatment needs to be described in the model documentation.
Exploratory Data Analysis (EDA) is a predetermined set of statistics and visual tests. It is an essential instrument and a comprehensive analysis that allows us to deal with messy and complex data in the model development datasets. Especially as the size of the data increases and becomes difficult to analyse, EDA speeds up this process by producing results visually, textually, and statistically. We aim to apply EDA to detect outliers, understand data patterns, and ensure adequate data quality checks.
Errors in the data extraction procedure, poor programming, or not using enough identifiers sometimes cause duplicate records. If the unique identifier, namely the primary key, is not unique, it is a duplicate record. Duplication can occur where different records share the same key.
The general approach in this treatment is to identify duplicate records and remove unnecessary observations. This process should be carried out in consultation with all stakeholders.
Is there any regulation regarding data? Various committees and authorities have released new standards and regulations after the banking sector's 2007-2009 financial crisis. Capital Requirements Regulation (CRR) 2013 touches on several data-related critical points. It contains some historical provisions regarding data, such as a minimum of 5 years for exposure of model development, in data-related articles. However, the main requirement is to create a robust data framework, strong risk data aggregation capabilities, and establish data quality dimensions, such as accuracy, completeness, and appropriateness.
Also, some reports indirectly support the modelling activities published by the BIS (Bank for International Settlements) or the EBA (European Banking Authority). These are the Principles for Effective Risk Data Aggregation and Risk Reporting ("BCBS 239") 2013 and Commission Delegated Regulation (EU) 2022/439. These publications focus on data requirements for regulatory reporting, so they indirectly support modelling activities (If the data is available in a reliable, transparent, etc., data warehouse, it is easier to collect data for modelling).
Data management and governance remain challenging for the finance industry. For this reason, many financial institutions would benefit from building well-designed data structures, including internal and external data sources. Also, financial institutions must have clearly defined data management policies and allocate responsibilities across relevant user profiles and data owners. The data management framework must have transparent, accessible and consistent controls implemented by the financial institution.
Finalyse InsuranceFinalyse offers specialized consulting for insurance and pension sectors, focusing on risk management, actuarial modeling, and regulatory compliance. Their services include Solvency II support, IFRS 17 implementation, and climate risk assessments, ensuring robust frameworks and regulatory alignment for institutions. |

Check out Finalyse Insurance services list that could help your business.
Get to know the people behind our services, feel free to ask them any questions.
Read Finalyse client cases regarding our insurance service offer.
Read Finalyse blog articles regarding our insurance service offer.
Designed to meet regulatory and strategic requirements of the Actuarial and Risk department
Designed to meet regulatory and strategic requirements of the Actuarial and Risk department.
Designed to provide cost-efficient and independent assurance to insurance and reinsurance undertakings
Finalyse BankingFinalyse leverages 35+ years of banking expertise to guide you through regulatory challenges with tailored risk solutions. |

Designed to help your Risk Management (Validation/AI Team) department in complying with EU AI Act regulatory requirements
A tool for banks to validate the implementation of RWA calculations and be better prepared for CRR3 in 2025
In 2027, FRTB will become the European norm for Pillar I market risk. Enhanced reporting requirements will also kick in at the start of the year. Are you on track?
Finalyse ValuationValuing complex products is both costly and demanding, requiring quality data, advanced models, and expert support. Finalyse Valuation Services are tailored to client needs, ensuring transparency and ongoing collaboration. Our experts analyse and reconcile counterparty prices to explain and document any differences. |

Helping clients to reconcile price disputes
Save time reviewing the reports instead of producing them yourself
Helping institutions to cope with reporting-related requirements
Be confident about your derivative values with holistic market data at hand
Finalyse PublicationsDiscover Finalyse writings, written for you by our experienced consultants, read whitepapers, our RegBrief and blog articles to stay ahead of the trends in the Banking, Insurance and Managed Services world |

Finalyse’s take on risk-mitigation techniques and the regulatory requirements that they address
A regularly updated catalogue of key financial policy changes, focusing on risk management, reporting, governance, accounting, and trading
Read Finalyse whitepapers and research materials on trending subjects
About FinalyseOur aim is to support our clients incorporating changes and innovations in valuation, risk and compliance. We share the ambition to contribute to a sustainable and resilient financial system. Facing these extraordinary challenges is what drives us every day. |

Finalyse CareersUnlock your potential with Finalyse: as risk management pioneers with over 35 years of experience, we provide advisory services and empower clients in making informed decisions. Our mission is to support them in adapting to changes and innovations, contributing to a sustainable and resilient financial system. |

Get to know our diverse and multicultural teams, committed to bring new ideas
We combine growing fintech expertise, ownership, and a passion for tailored solutions to make a real impact
Discover our three business lines and the expert teams delivering smart, reliable support