

By Augustin de Maere, Managing Consultant
and Marino San Lorenzo, Consultant
The world of analytics has significantly changed in the last couple of years. As known since Kuhn, any paradigm shift is often accompanied by a change in language, so the choice of the programming languages used for modelling has also significantly changed since then.
While 10 years ago, SAS was the mainstream language for credit risk modelling, with some niche markets occupied by languages such as Matlab, the rapid development of the field now known as data science has changed the rules of the game.
Among the new challengers, we can find Python and R. Both these languages have experienced a tremendous increase in popularity in the last few years and are now serious competitors for SAS. Both are also open source.
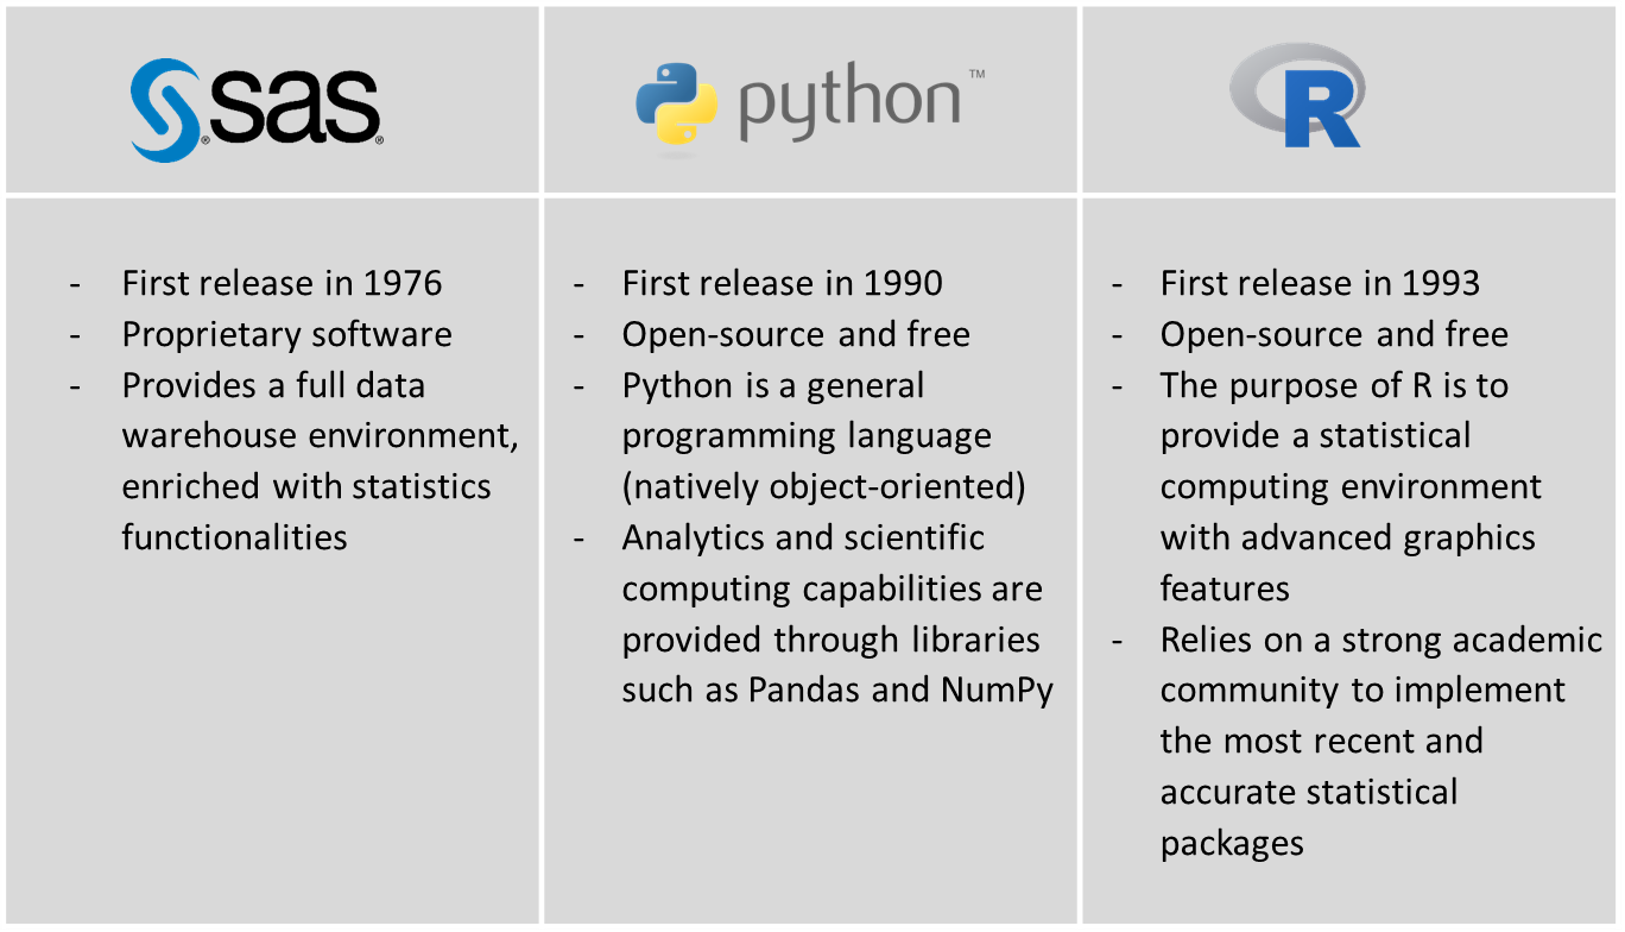
A short presentation of each language is provided in the table below:
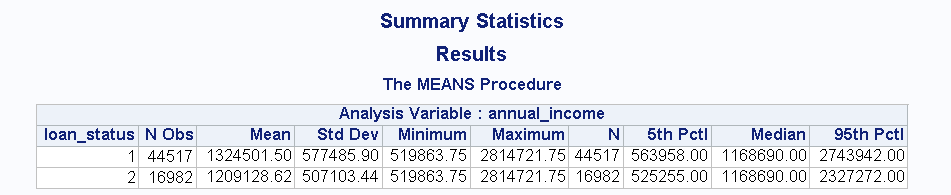
The exercise consisted in calibrating a logistic regression to identify loans likely not to be repaid on time in a sample dataset. The choice of logistic regression was driven by the fact that it is a simple but powerful approach still widely used in the industry. For that purpose, the Bank Loan Status Dataset of Kaggle was used. The dataset consists of around 80,000 observations, which were split in a train and test dataset. The dataset contains a significant number of observations but is also murky (missing variables, invalid values, etc.).
Logistic regression models are often built using a kind of stepwise selection of explanatory variables. A blind stepwise selection is usually not recommended, and most practitioners tend to include different factors to identify the meaningful variables to incorporate in the model.
Quantitative factors |
|
Qualitative factors |
|
SAS
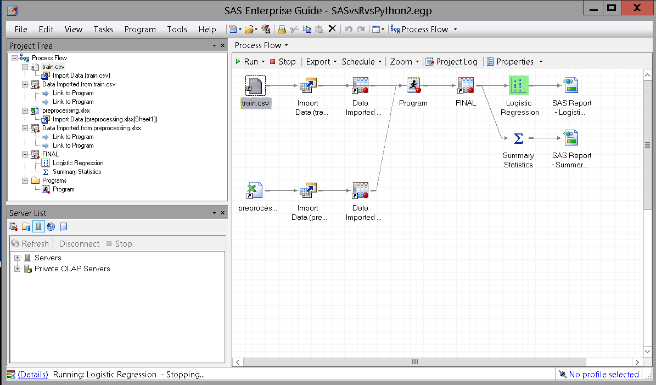
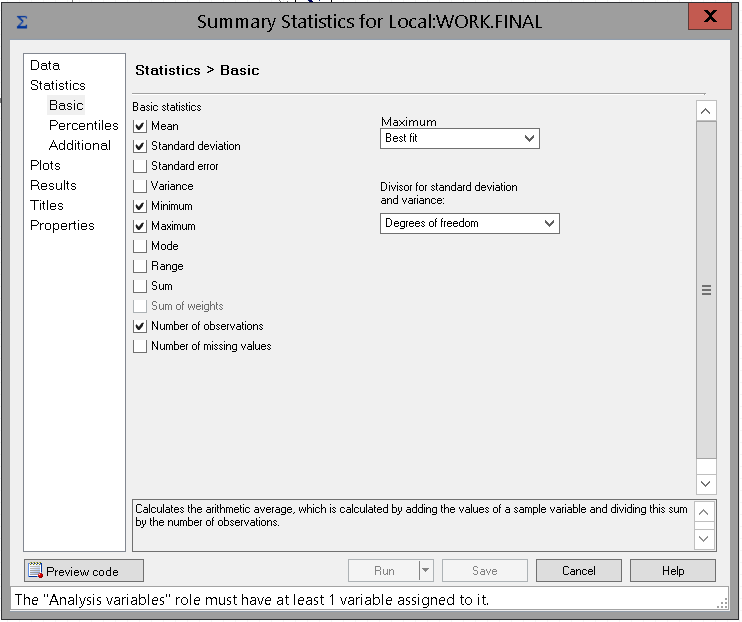
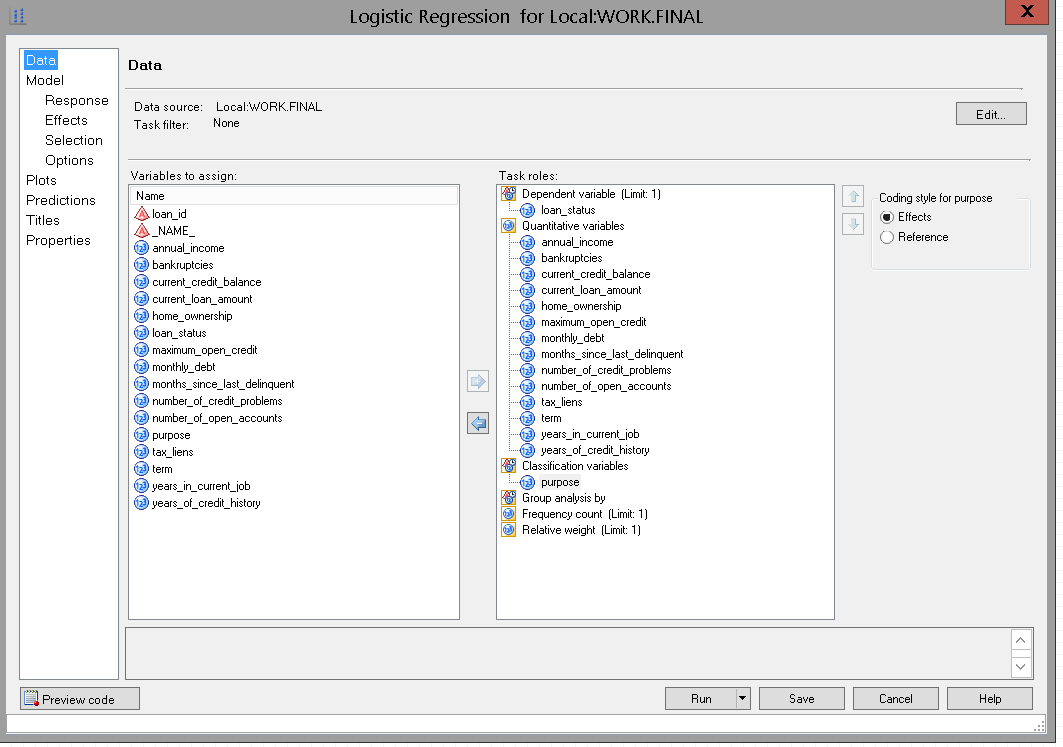
SAS was used in its Enterprise Guide edition. Enterprise Guide provides a graphical user interface to design the underlying SAS code (see figure below). The options of the different procedures may be provided through configuration menus. It is also possible to directly code in SAS, but the SAS syntax is centred on data sets which are first-class citizens in the SAS eco-system. Manipulating any other type of objects (such as strings, or even more abstract concepts) quickly becomes difficult.
R
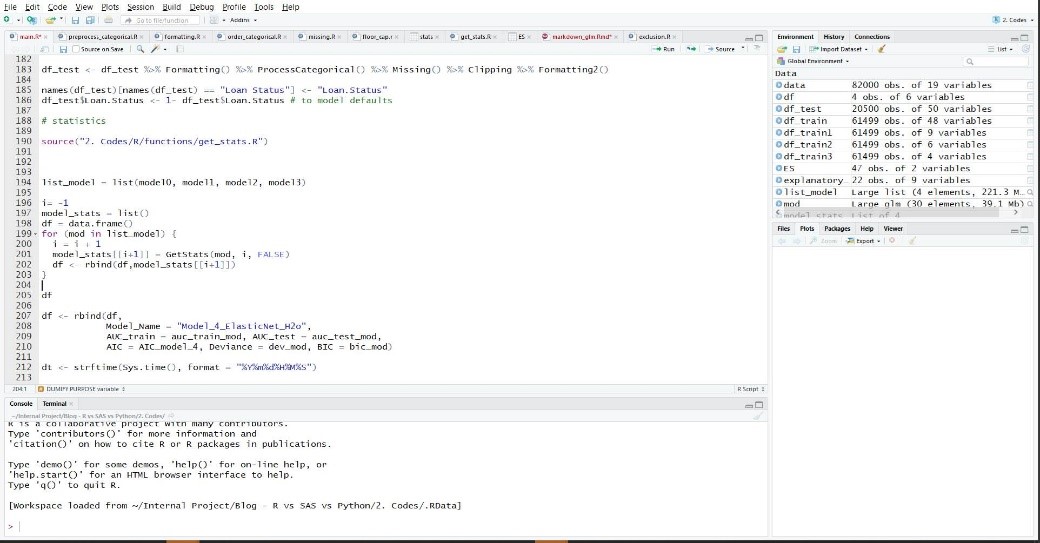
The best interface for R is probably the RStudio editor. Apart from the usual syntax colouring and editing capabilities, RStudio is particularly interesting in combination with the Shiny extension, which allows to easily develop an application with a user interface. In addition, automated reports can be enriched with the R Markdown extensions.
Python
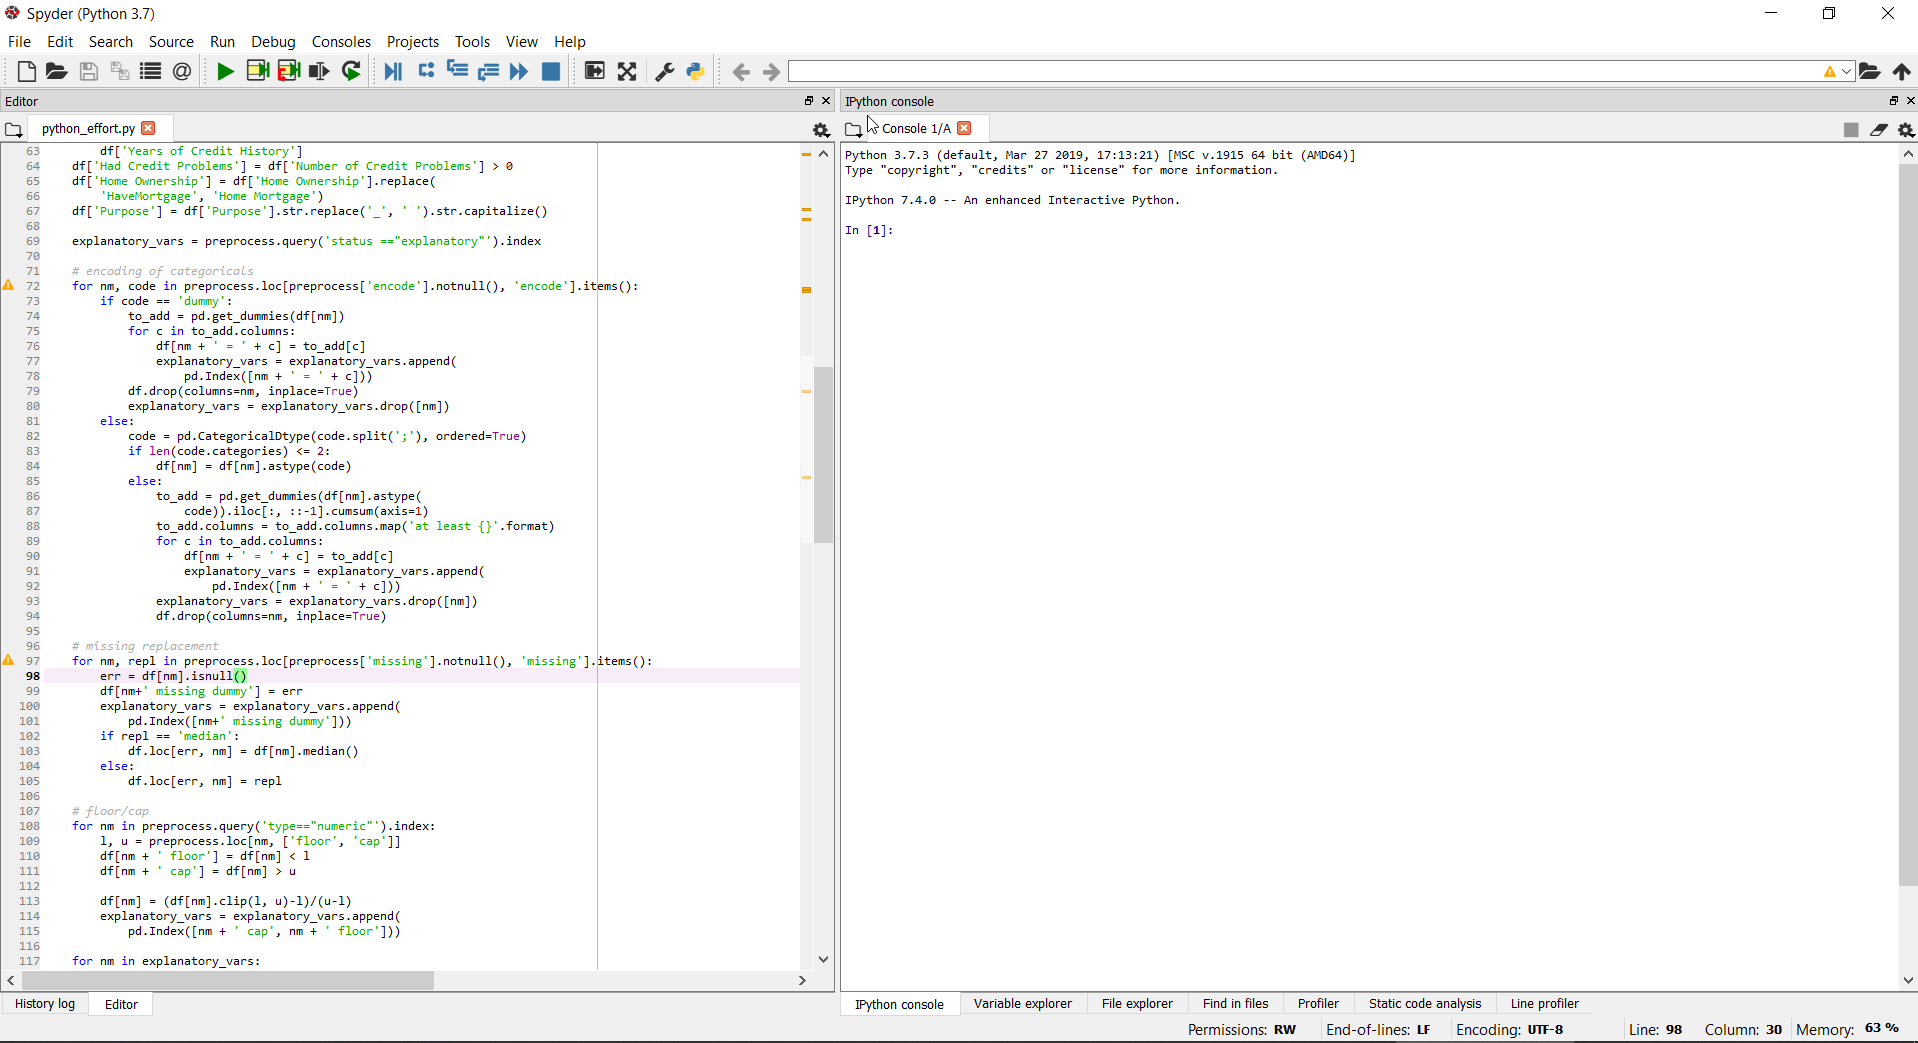
Finally, Python is used with the Spyder editor, which comes with the usual code editing functionalities (syntax colouring, auto-completion, tabs, etc.). While the interface of Spyder is not as rich as the ones of RStudio or SAS Enterprise Guide, it is largely compensated by the simplicity of the Python language itself. Indeed, Python’s syntax is easy to read but also powerful. Python is natively object-oriented: models are therefore created as objects, which can be manipulated easily. Practically, it means that a specific model can be represented as a dedicated object, which can directly be passed as input into functions, instead of having to pass all the parameters of the model, for instance. String manipulations are also made extremely simple in Python.
While often neglected in the academic literature, the pre-processing step is certainly one of the most important element of the modelling process. Apart from the necessary cleansing of the data, it also includes the feature engineering, with the proper encoding of categorical features, and the definition of ratios derived from primary features. Being dimensionless quantities, ratios are most stable through time and often also have better generalization properties.
In our case, the pre-processing step involves the train/test split of the dataset, and the creation of different ratios. We also performed the replacement of missing values (based on the median), and 5-95 outlier capping. Specific treatments were reserved for ordinal variables. Categorical variables were one-hot encoded. For some variables for which an ordering was possible, the variables were furthermore ordinally encoded.
For the pre-processing step, Python and R proved to be extremely efficient. Many of the operations could be performed using built-in functions. The scripting nature of these languages also allowed to directly interact with the dataset.
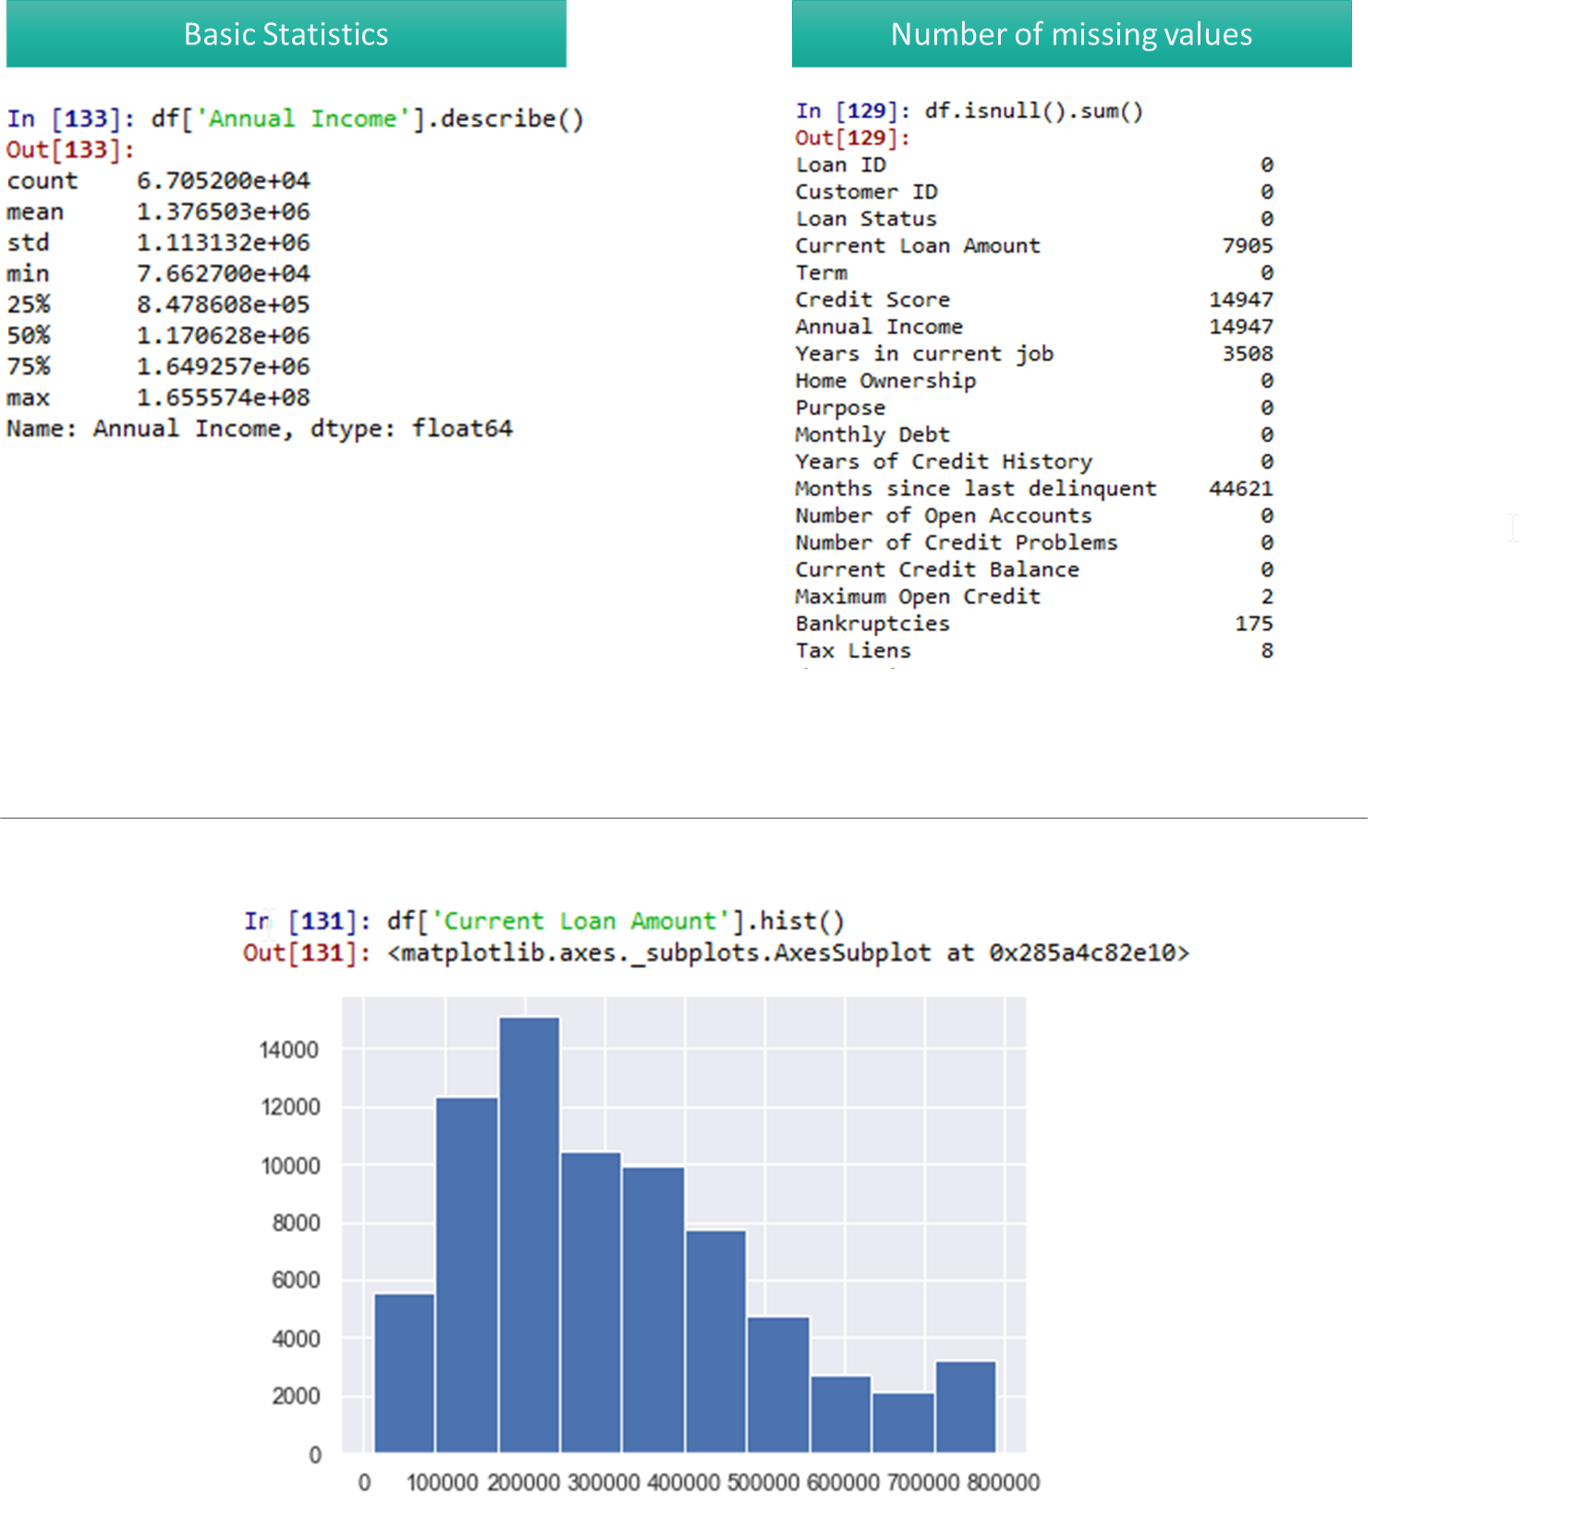
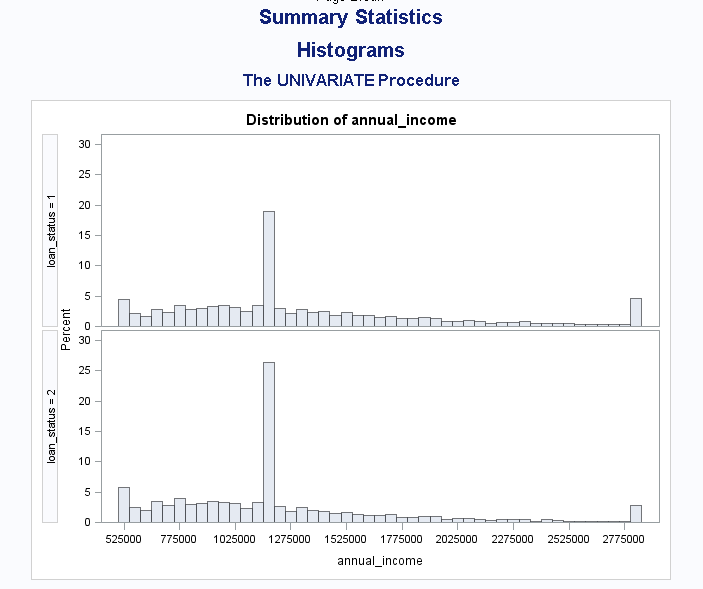
In Python, the data is read from csv files using the pandas library, which provides a solution for manipulating tabular data. Analysing the dataset could directly be performed using simple commands. Python also offers some powerful graphical libraries and plots of variables are also easily generated in one line of code.
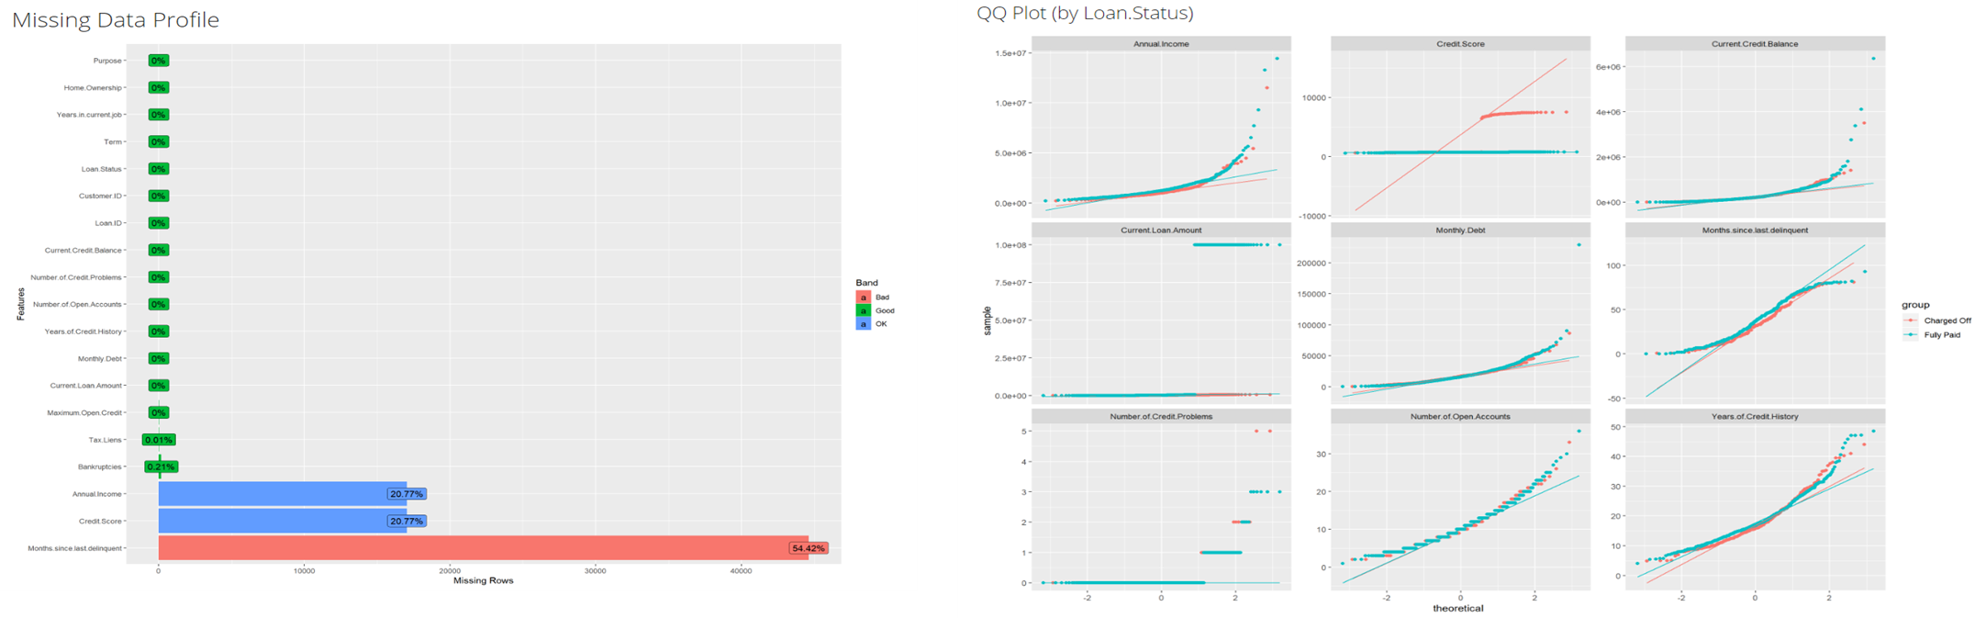
For quick data exploration and reports, R allows to get real fast visualisations reports thanks to the libraries DataExplorer and esquisse, and to get a touch of the dataset. With only one line of code, we can derive a detailed report to get a first intuition on our data and know where to focus on during the pre-processing phase (cf. example):
# R : quick data visualisation:
create_report (data, y = "loan status")
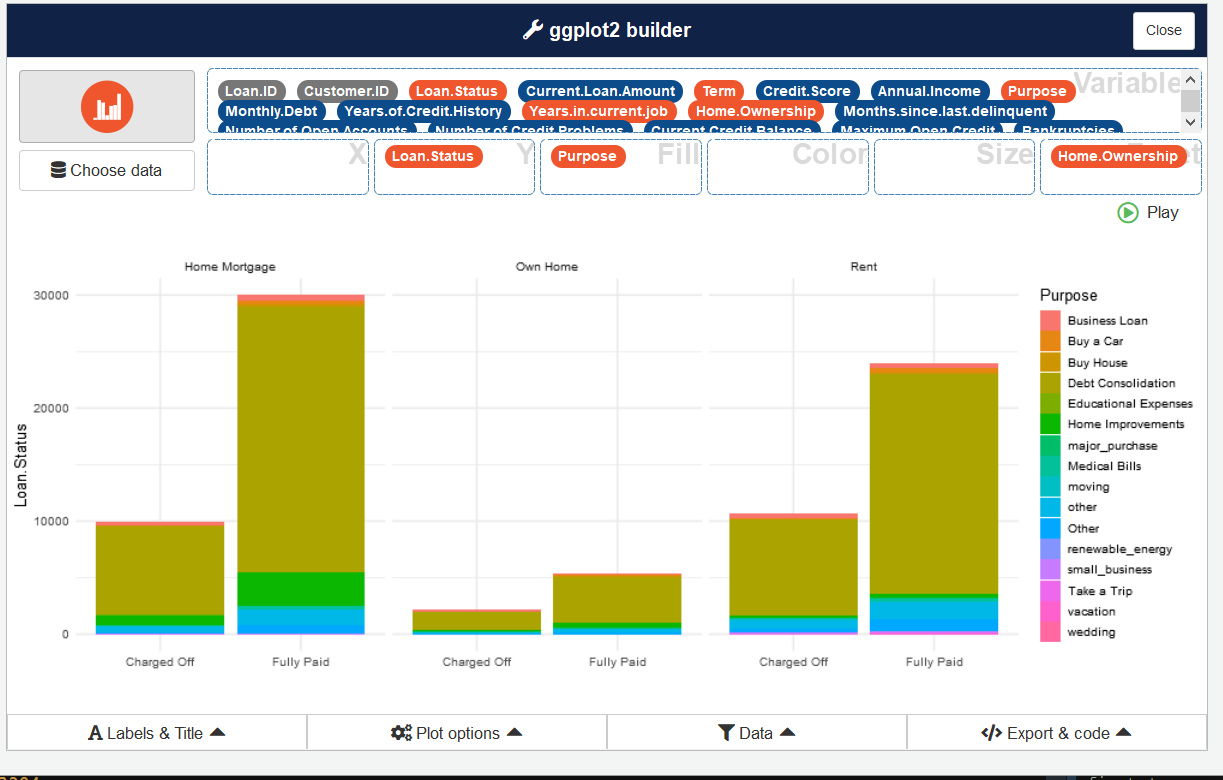
For more flexibility and quick results, we can use the esquisse library which will launch an application allowing the user to create custom graphs. More elaborated plots can also be generated using the ggplot2 library.
The pre-processing is a bit more tedious in SAS. While automated solutions are available for the simplest tasks, going for the extra mile is a bit more challenging. On the other hand, if the data initially is in SAS, it gives a strong advantage to SAS, since it eases the data flows. For instance, it allows to quickly reparametrize the model with new data, by simply connecting to the relevant datasets owned by the business.
SAS
SAS directly provides an algorithm for the stepwise selection with PROC LOGISTIC. The algorithm is efficient and all the necessary statistics are included. The stepwise selection is however fully automated and only based on significance levels. What is more, overfitting risk is often reduced using other statistical metrics (such as Bayesian or Akaike information criterions) and expert knowledge (expected signs for instance). Incorporating this in the selection process cannot be performed using the user interface, and would require coding a loop over all regressions, which may become a daunting task because of SAS’s limited flexibility.
Python
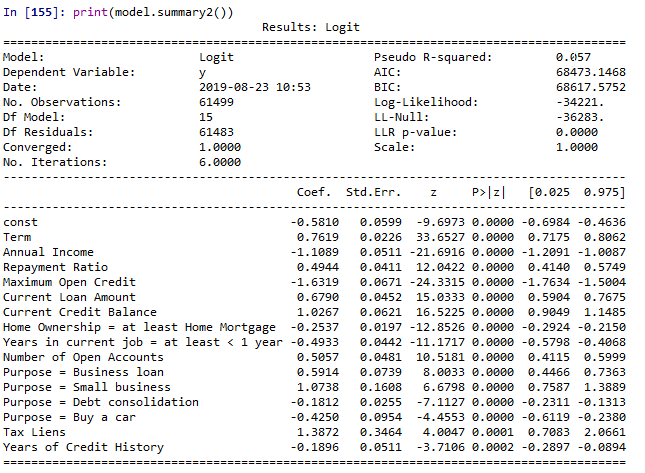
Different modules are providing logistic regressions in Python. The scikit-learn module is primarily a machine learning package, and only provides the implementation of regularized (L1 or L2) logistic regressions. While some basic indicators are directly available, p-values have to be recalculated by the user. For these reasons, the statsmodels module was preferred. The module is more focused on traditional statistics, and indeed provides all the classical statistics for a logistic regression. However, the statsmodels module does not directly provide a function for calculating the AUC. The function is easily found in the scikit-learn module, but this is an example of the fact that the Python ecosystem is sometimes fragmented.
A stepwise selection is not implemented by default in Python, but creating a loop for doing it is no issue:
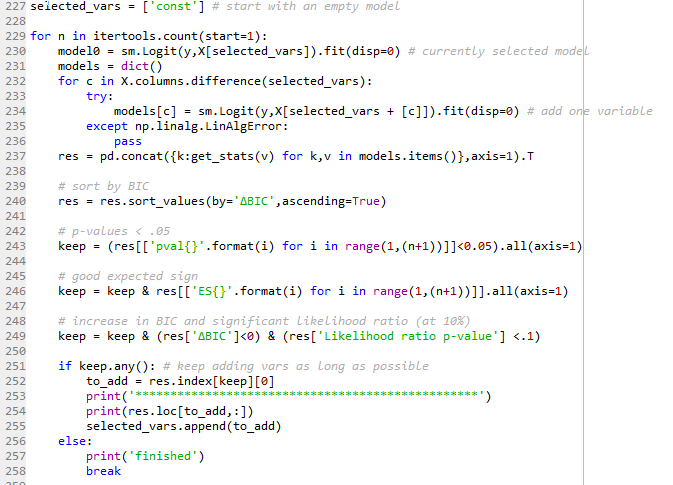
All the details of the fitted model are also available as output for prints in the model object:
R
R provides a large range of package for modelling GLMs. The user is spoilt for choice. The two most commonly used libraries are stats and glmnet. Applying the above described methodology, R, through the basic package stats package, renders the following output:
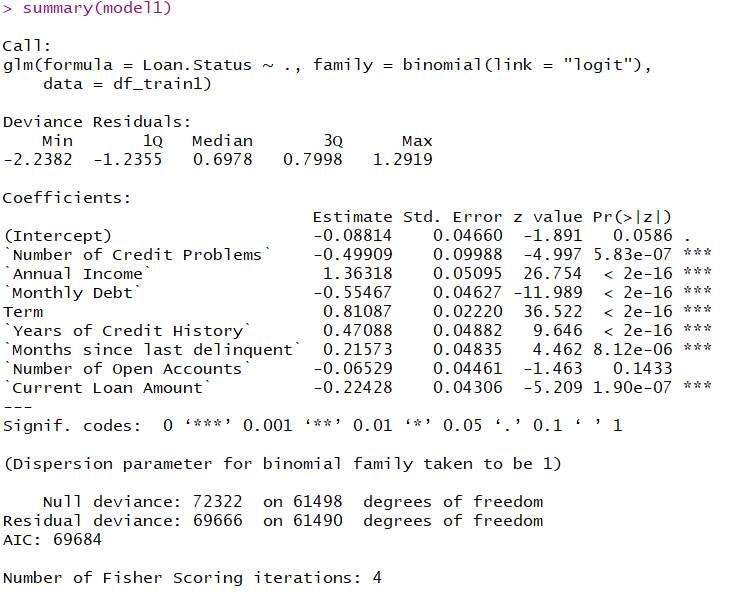
The summary function returns the regression diagnostic. Strongly significant variables are highlighted with a three star grade. Statistics of the residuals are also returned, as well as the model deviance. Finally, a dedicated function (screenreg) produce a comparative table of different models for the user to pick the best one.
SAS is a rigid solution, which will perform at its best in an existing SAS environment. The construction of simple models is possible in SAS, but even small changes would require a significant amount of coding.
Python is a flexible solution, but it requires some coding knowledge and statistics knowledge. All the building blocks and necessary statistics are available, but some are dispersed among different packages. The creation of a solution therefore requires more effort at first, but the solution will however be fully-tailored.
R is a diesel/ready-to-use solution. Compared to Python, R has a steeper learning curve. Its syntax is a bit heavier and more error-prone, but all necessary statistics are available. The need for coding your own function is also more limited but still easily feasible even for users who are new to the language, and we shouldn’t forget to mention R’s graphic capabilities, which undoubtedly outperform both Python and SAS.
Please note that this conclusion has been made and holds only in the context of this exercise. By no means do we wish to imply general superiority of any language over another or that the conclusion would hold in cases other than this one.
Finalyse InsuranceFinalyse offers specialized consulting for insurance and pension sectors, focusing on risk management, actuarial modeling, and regulatory compliance. Their services include Solvency II support, IFRS 17 implementation, and climate risk assessments, ensuring robust frameworks and regulatory alignment for institutions. |

Check out Finalyse Insurance services list that could help your business.
Get to know the people behind our services, feel free to ask them any questions.
Read Finalyse client cases regarding our insurance service offer.
Read Finalyse blog articles regarding our insurance service offer.
Designed to meet regulatory and strategic requirements of the Actuarial and Risk department
Designed to meet regulatory and strategic requirements of the Actuarial and Risk department.
Designed to provide cost-efficient and independent assurance to insurance and reinsurance undertakings
Finalyse BankingFinalyse leverages 35+ years of banking expertise to guide you through regulatory challenges with tailored risk solutions. |

Designed to help your Risk Management (Validation/AI Team) department in complying with EU AI Act regulatory requirements
A tool for banks to validate the implementation of RWA calculations and be better prepared for CRR3 in 2025
In 2027, FRTB will become the European norm for Pillar I market risk. Enhanced reporting requirements will also kick in at the start of the year. Are you on track?
Finalyse ValuationValuing complex products is both costly and demanding, requiring quality data, advanced models, and expert support. Finalyse Valuation Services are tailored to client needs, ensuring transparency and ongoing collaboration. Our experts analyse and reconcile counterparty prices to explain and document any differences. |

Helping clients to reconcile price disputes
Save time reviewing the reports instead of producing them yourself
Helping institutions to cope with reporting-related requirements
Be confident about your derivative values with holistic market data at hand
Finalyse PublicationsDiscover Finalyse writings, written for you by our experienced consultants, read whitepapers, our RegBrief and blog articles to stay ahead of the trends in the Banking, Insurance and Managed Services world |

Finalyse’s take on risk-mitigation techniques and the regulatory requirements that they address
A regularly updated catalogue of key financial policy changes, focusing on risk management, reporting, governance, accounting, and trading
Read Finalyse whitepapers and research materials on trending subjects
About FinalyseOur aim is to support our clients incorporating changes and innovations in valuation, risk and compliance. We share the ambition to contribute to a sustainable and resilient financial system. Facing these extraordinary challenges is what drives us every day. |
Finalyse CareersUnlock your potential with Finalyse: as risk management pioneers with over 35 years of experience, we provide advisory services and empower clients in making informed decisions. Our mission is to support them in adapting to changes and innovations, contributing to a sustainable and resilient financial system. |

Get to know our diverse and multicultural teams, committed to bring new ideas
We combine growing fintech expertise, ownership, and a passion for tailored solutions to make a real impact
Discover our three business lines and the expert teams delivering smart, reliable support