In July 2025, the European Banking Authority (EBA) published the draft Guidelines on Credit Conversion Factor (CCF) estimation and application methodologies (hereafter, draft CCF GLs) for public consultation, which is scheduled to conclude on 29 October 2025. These draft CCF GLs represent a significant milestone in the history of CCF models, as they mark the first comprehensive formalization by the EBA of regulatory expectations and interpretations under the CRR framework. While the document is still in the draft form, it provides valuable insight into the regulatory vision of the future of the CCF models, enabling industry experts to assess potential impacts and prepare for the coming changes.
This blogpost is to analyze the implications of selected changes introduced in the draft CCF GLs. Specifically, it will assess the direction of the expected impact of these changes on existing CCF models and respective RWA (risk-weighted assets) impacts, and evaluate the operational and methodological adjustments likely required from banks’ modelling teams to align their current IRB (Internal Rating Based) models to the new regulatory environment.
The analysis provided focuses specifically on aspects most relevant to the model development process for retail portfolios.
Part 3 outlines a potential approach to account for the correlation between CCF and default rates (DR), proceeds with an evaluation of the conditions for applying flat conservative CCFs and concludes with clarification of how the undrawn amount should be interpreted.
The CCF is one of the three parameters making up the A-IRB models. Its role is to calculate a bank's exposure to off-balance-sheet items. In essence, a CCF is a percentage used to estimate the portion of an undrawn credit commitment that a borrower is likely to draw down between the estimation date and the time of default (ToD).
As per Regulation (EU) 2024/1623 (known as CRR3), the CCF should be defined as:
where  is the amount drawn at ToD,
  - amount drawn at the time of the estimation (reference date
  and
and  - undrawn limit at the time of the estimation.
Art. 182(1) of CCR3 requires the institutions to apply an increased conservatism to CCF estimates where a material positive correlation is identified between default rates (hereafter, DR) and the magnitude of realized CCFs. The draft CCF GLs provide the EBA interpretation of this requirement, specifying that the assessment of such correlation should be performed within the context of the downturn CCF estimation. Consequently, the scope of the analysis is limited to evaluating this dependency as part of the downturn CCF framework, rather than as a separate, standalone exercise.
In the context of the draft CCF GLs, EBA proposes that, to comply with Article 182(1)(c) of the CRR3, institutions should use the yearly DR at the portfolio level as one of the risk factors in identifying economic downturn period relevant for CCF modelling. This represents a shift from earlier practices, where correlation between DR and CCFs (if tested at all) was typically addressed by applying a MoC if material dependencies were detected.
The EBA considers this approach sufficient to meet the regulatory requirement, as the dependency between DRs and CCFs is inherently assessed through the downturn CCF estimation process. In other words, the evaluation of the correlation between DR and CCFs conducted within the downturn CCF framework is considered adequate, since this relationship is already embedded in the downturn CCF analysis itself.
Based on the approach proposed by EBA, potential shifts in the final CCF estimates, and consequently in the corresponding RWA values, would primarily stem from changes in the final selected downturn period, triggered by the introduction of the DR as an additional risk factor. As a result, two outcomes are possible:
In the example below, we illustrate an approach towards the DT analysis that would include DR as a macroeconomic indicator of the economic DT period and assess the RWA impact of the change for the selected revolving unsecured retail portfolio of a European bank over the period 2004–2011 (includes the economic downturn associated with the Global Financial Crisis).
An analysis of macroeconomic indicators for the selected European economy shows a period of adverse macroeconomic conditions between 2008 and 2010, reflected in both GDP growth (annual, %) and unemployment (total, %), corresponding to the Global Financial Crisis (see Figure 1).
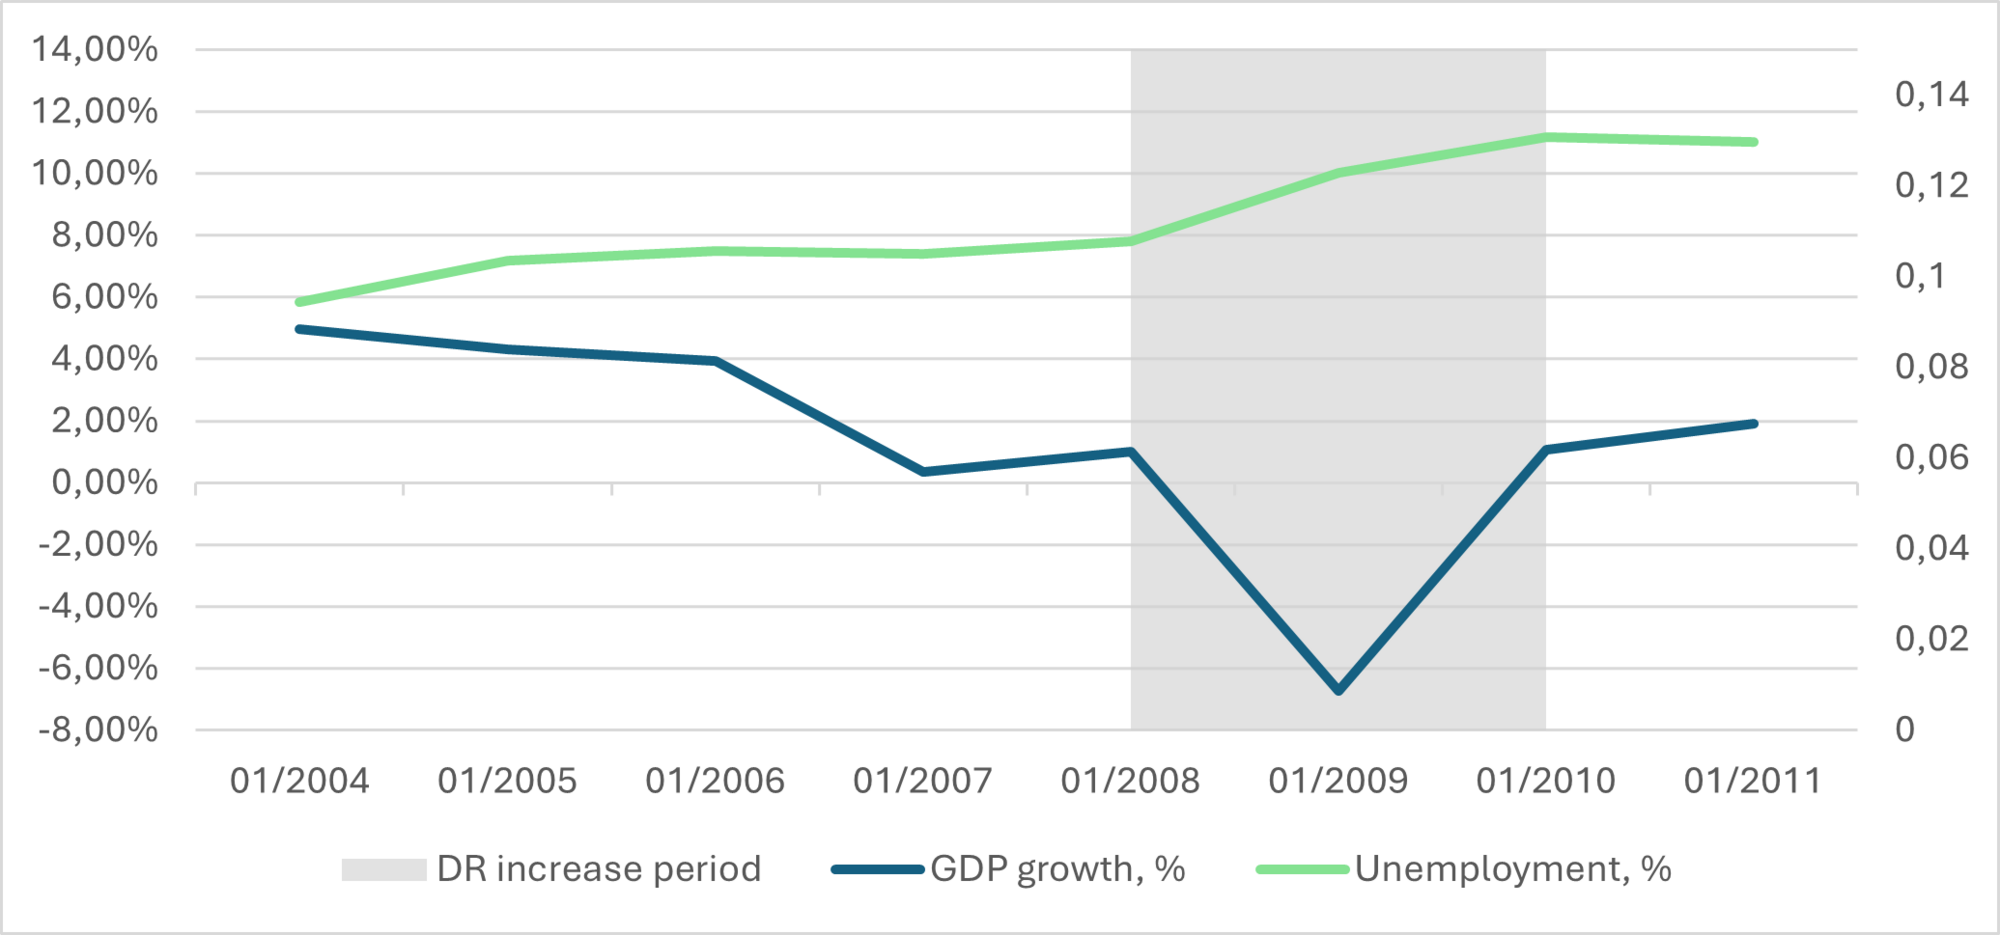
Figure 1: Macroeconomic indicators during the economic DT period
During this period, the observed DR in the institution’s retail portfolio increased sharply from below 0.5% to 3.5%, illustrating a strong dependency of DR on the general economic environment. In contrast, realized CCFs remained broadly stable at around 25%, showing no significant change in dynamics over the same period (see Figure 2).
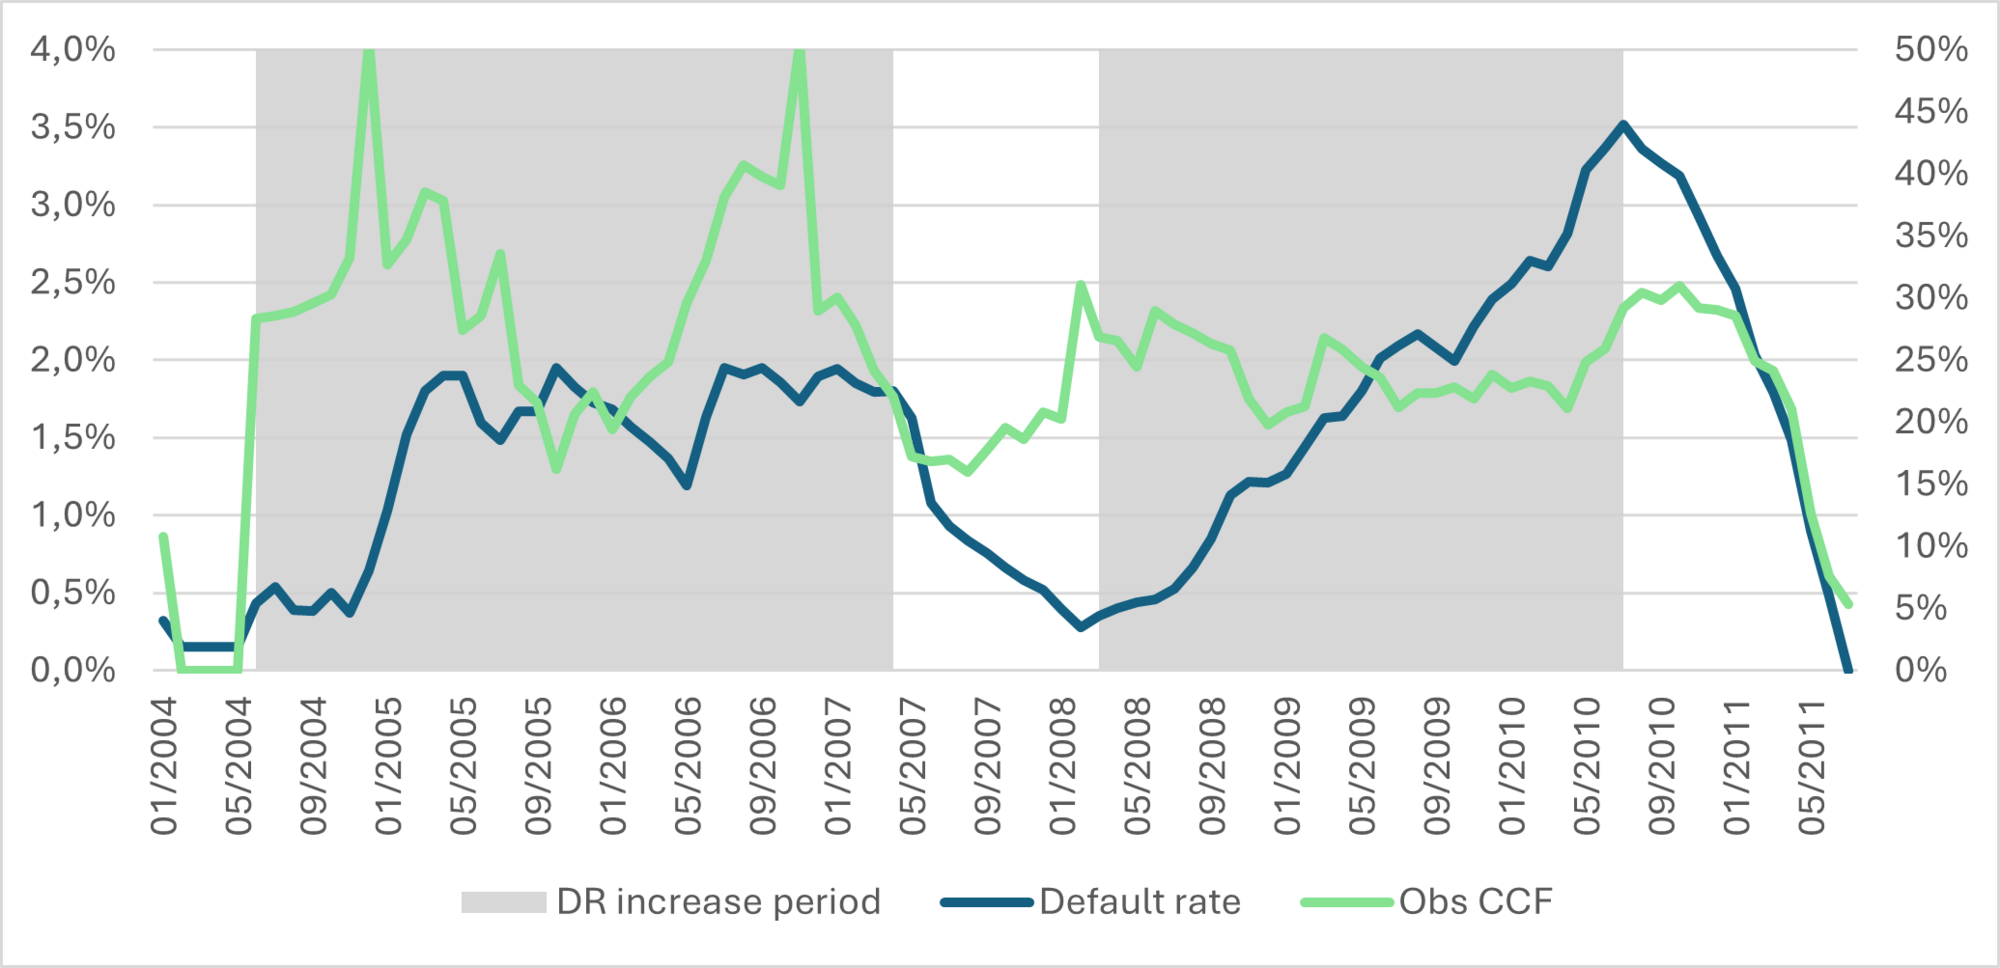
Figure 2: Default rate vs realized CCF time series, incl. Global Financial Crisis
However, considering solely the time series of DR, an alternative potential economic DT period can be identified between Q2 2004 and Q2 2007, the period that also corresponds to elevated levels of DR. During this period, realized CCFs reached historical peaks, supporting the consideration of this period as a potential DT period. The average realized CCF over this interval is approx. 30%, which is higher than that observed during the originally selected DT period. Consequently, in this example, the introduction of the DR as a macroeconomic indicator would lead to the selection of an alternative DT period associated with a higher DT CCF, resulting in an overall increase in RWA.
In addition, various studies for different product types or client sub-segments provide evidence of significant correlation between DR and CCF: Bergerès, d’Astous & Dionne, 2015 and Jiménez, López & Saurina (2008). This supports the expectation that introduction of DR into the CCF DT analysis might potentially result in an increase in the final CCF estimates.
To ensure compliance with regulatory requirements, institutions are expected to analyze the dependency between CCF and DR by including the latter into the list of the compulsory factors for defining the economic DT period. Given the evidence outlined above, inclusion of DR into the economic DT analysis can result in identification of new DT periods which are associated with higher DT CCFs.
For segments that are immaterial relative to the overall portfolio, contain limited historical data (e.g., low-default portfolios), and are highly homogeneous in terms of product type, client profile, or other relevant characteristics, the CCF may be assigned a flat, conservative value. The assigned value must reflect a genuine conservative estimate of the realized CCF and cannot be arbitrarily capped at 100% as CCF can exceed 100% in some cases, e.g. when the limit changes before default.
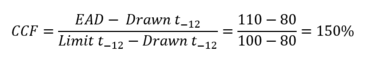
Consider a scenario where a facility’s limit increases from 100 to 120 EUR between the reference date (12 month before default,  ) and the ToD
  If the limit increased shortly before default, the borrower may draw above 100 EUR, resulting in CCF exceeding 100%.
Drawn at t-12 | EAD | Limit at t-12 | Limit at t0 |
80 | 110 | 100 | 120 |
For product types or segments where limit increases are permissible, instances of CCF above 100% can occur regularly. In such cases, applying a flat 100% would underestimate the actual CCF, hence, a higher CCF should be used to reflect the true risk.
While the principle is already outlined in earlier regulatory requirements [CRR3 Art. 182(1b)], the draft CCF GLs stress that the selection of a flat, conservative CCF must be well-justified, documented, and subject to periodic monitoring and internal validation. Essentially this approach is only allowed when statistical estimation of CCF is unreliable due to the segment immateriality or scarcity of the data. Institutions must also ensure that the defined conservative value remains prudent over time by comparing it with the realized historical CCFs of defaulted facilities within the relevant segment (back-testing).
In case the segments to which a flat CCF is currently assigned do not meet the regulatory criteria for applying a conservative CCF, proper models must be developed for those segments. The resulting impact on LRA CCF and RWA can be either positive or negative, depending on the model outcomes.
For segments that do meet the criteria but where institutions cap the flat CCF at 100% without demonstrating that this estimate is adequate, the flat CCF should be reassessed and potentially increased, which would likely lead to higher RWA. The magnitude of the increase depends on the materiality of the segment within the application portfolio.
The CCF definition is based on drawn and undrawn parts of a credit commitment. This undrawn amount should be calculated, as per par. 71 of the draft CCF GLs, as difference between the maximum of the advised and unadvised limit of a credit commitment, and the amount already drawn.
An unadvised limit is defined as “any credit limit determined by the institution and about which the obligor has not been informed by the institution and according to which additional drawings beyond the advised limit are at least temporarily possible.” For example, for a debit card with an overdraft limit of €1,000 (the advised limit) the actual amount the customer can withdraw could be €1,200, even if not stated in their contractual brochure.
Any potential change of advised limit requiring an action from the obligor, even if this change is automatically approved by the bank without any review, is not considered as an unadvised limit.
Prior to this clarification, the most frequent way to compute the undrawn part of a credit commitment was to take the difference between the advised limit and the drawn amount. The new refined definition of the undrawn amount implies that this portion is now larger than previously estimated and will lead to lower realized CCFs, especially for realized CCFs above 100%, as the realized drawn amount at default can be higher than the advised limit.
For example, let’s assume a credit commitment for which the obligor has drawn €50 12 months before default, the advised limit is €100 and the unadvised limit is €115. At default, the obligor has drawn €105, as it is technically feasible (even if not advertised as such in the contractual clauses).

In this case, taking into account only the advised limit as the undrawn amount would result in a 110% CCF, while considering the maximum of the advised and unadvised limits would give a 91.67% CCF.
The definition of what an unadvised limit is, and the prohibition of taking potential higher advised limits even if they are automatically approved by the bank, is a clarification on the practices related to the realized CCFs calculations. Indeed, there was an on-going debate about taking the maximum potential advised limit in the undrawn amount calculation or not. Let’s consider the following example, where the obligor requested an increase of its advised limit (from €1,000 to €2,000) and has drawn funds (€1,600) in excess of its original unadvised limit (€1,100):
| Drawn amount | Advised limit | Unadvised limit | Drawn at default | CCF |
Current unadvised limit | 500 | 1000 | 1100 | 1600 | 183.33% |
Maximum potential advised limit | 500 | 1000 | 2000 | 1600 | 73.33% |
If the unadvised limit included the maximum potential advised limit, the CCF would be 73.33%. However, with the clarified definition of unadvised limit as the currently maximum amount the obligor can technically draw, the CCF is 183,33%, in excess of 100%.
The RWA impact of this change of definition is theoretically null, as it only changes the way the realized CCF is recorded, without impacting its amount in euros. However, due to the change in the definition of the predicted variable (realized CCF in percentage), it could impact the discriminatory power of the CCF models. By taking an undrawn amount definition of the credit commitment closer to the ability of the obligors to draw funds, we are of the opinion that it should slightly increase or at least not decrease the models’ discriminatory power if they were re-trained on the clarified CCF definition.
It is important to note that the definition of the undrawn amount should be consistent during the review of estimates exercises, as indicated in par. 163 b of the draft CCF GL.
The table below summarizes the key focus areas of the draft CCF GLs outlined above and their expected impact on RWA (graphically in the respective column below). The requirements with “high” (red arrows) RWA impact are expected to cause the most noticeable increase in the RWA values. The implementation of the “medium” impact points (orange arrows) is expected to result in limited RWA increase. The remaining requirements are not associated with a predetermined increase or decrease in RWA, as their impact may vary depending on the characteristics of each individual portfolio.
In addition, the summary table provides an indicative assessment of the implementation effort required to adapt the existing models in the European banks (based on common market practices) to the draft requirements, should they come into force in the current form. In this context, low effort refers to adjustments such as sample filtering or model recalibration; medium effort corresponds to changes in risk differentiation or the reconstruction of risk driver functions; and high effort involves fundamental changes to model design and a full redevelopment.

Finalyse InsuranceFinalyse offers specialized consulting for insurance and pension sectors, focusing on risk management, actuarial modeling, and regulatory compliance. Their services include Solvency II support, IFRS 17 implementation, and climate risk assessments, ensuring robust frameworks and regulatory alignment for institutions. |

Check out Finalyse Insurance services list that could help your business.
Get to know the people behind our services, feel free to ask them any questions.
Read Finalyse client cases regarding our insurance service offer.
Read Finalyse blog articles regarding our insurance service offer.
Designed to meet regulatory and strategic requirements of the Actuarial and Risk department
Designed to meet regulatory and strategic requirements of the Actuarial and Risk department.
Designed to provide cost-efficient and independent assurance to insurance and reinsurance undertakings
Finalyse BankingFinalyse leverages 35+ years of banking expertise to guide you through regulatory challenges with tailored risk solutions. |

Designed to help your Risk Management (Validation/AI Team) department in complying with EU AI Act regulatory requirements
A tool for banks to validate the implementation of RWA calculations and be better prepared for CRR3 in 2025
In 2027, FRTB will become the European norm for Pillar I market risk. Enhanced reporting requirements will also kick in at the start of the year. Are you on track?
Finalyse ValuationValuing complex products is both costly and demanding, requiring quality data, advanced models, and expert support. Finalyse Valuation Services are tailored to client needs, ensuring transparency and ongoing collaboration. Our experts analyse and reconcile counterparty prices to explain and document any differences. |

Helping clients to reconcile price disputes
Save time reviewing the reports instead of producing them yourself
Helping institutions to cope with reporting-related requirements
Be confident about your derivative values with holistic market data at hand
Finalyse PublicationsDiscover Finalyse writings, written for you by our experienced consultants, read whitepapers, our RegBrief and blog articles to stay ahead of the trends in the Banking, Insurance and Managed Services world |

Finalyse’s take on risk-mitigation techniques and the regulatory requirements that they address
A regularly updated catalogue of key financial policy changes, focusing on risk management, reporting, governance, accounting, and trading
Read Finalyse whitepapers and research materials on trending subjects
About FinalyseOur aim is to support our clients incorporating changes and innovations in valuation, risk and compliance. We share the ambition to contribute to a sustainable and resilient financial system. Facing these extraordinary challenges is what drives us every day. |

Finalyse CareersUnlock your potential with Finalyse: as risk management pioneers with over 35 years of experience, we provide advisory services and empower clients in making informed decisions. Our mission is to support them in adapting to changes and innovations, contributing to a sustainable and resilient financial system. |

Get to know our diverse and multicultural teams, committed to bring new ideas
We combine growing fintech expertise, ownership, and a passion for tailored solutions to make a real impact
Discover our three business lines and the expert teams delivering smart, reliable support