

By Vera Jotanovic, Consultant
and Kristian Lajkep, Regulatory Compliance Officer
The contemporary advances in machine learning (ML) may have a profound influence on the risk management procedures, as these methods enable the analysis of very large amounts of data while contributing to an in-depth predictive analysis, and can improve analytical capabilities across risk management and compliance areas. Any market participant whose key activities involve digitalization and application of ML estimation techniques can benefit from:
Machine learning may become particularly indispensable in risk management. For instance, as regards the credit risk management, the automation of credit processes and the digitalization of the key steps in the credit value chain are likely to yield significant cost savings. In addition, credit risk costs can be further reduced through integrating new data sources and applying advanced-analytics techniques. These improvements generate richer insights for better risk decisions and ensure more effective and forward-looking credit risk monitoring. A particular contribution, already put into practice, is the use of ML methods for the estimations of crucial inputs in credit risk modelling: Probability of Default (PD), Loss Given Default (LGD) and Exposure at Default (EAD), which we can estimate by applying different ML estimation methods depending on the data availability and our preferences. These methods can be particularly relevant in the case of data scarcity, such as risk modelling of low default portfolios (LDPs).
Finalyse is currently exploring multiple ways in which ML can be employed to benefit its customers, particularly to improve efficiency and decrease costs of Credit risk modelling. This article offers a brief non-exhaustive list of the approaches we are currently exploring.
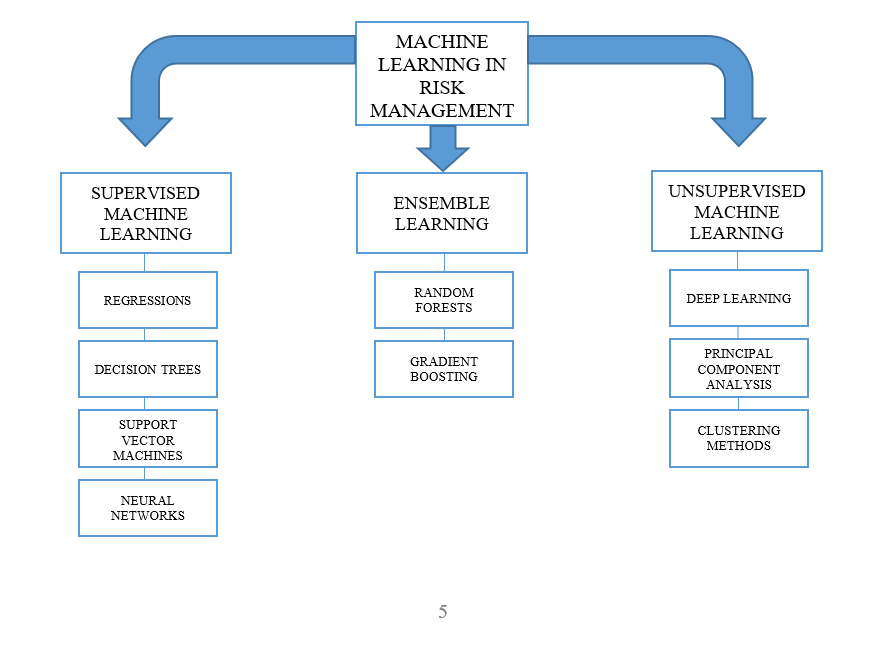
The main three categories of Machine Learning are:
All categories comprise different estimation techniques that are useful in risk management, but, at present, Supervised and Ensemble Machine Learning have wider applications in the field.
In Supervised Machine Learning (SML), a fundamental function is the objective function defined as:
Obj(Θ)=L(Θ)+Ω(Θ)
Where L(Θ) is the Loss function measuring how well the model fits to the training data (quality of prediction) and Ω(Θ) is the regularization term calculating the complexity of the model, more precisely, the variance. SML comprises several methods that are particularly useful for estimating crucial inputs in credit risk modelling (PD, LGD, EAD). In this short overview, we present the most useful SML techniques that some of our customers may benefit from. The methods are categorized in the following groups: Regressions, Decision Trees, Support Vector Machines and Artificial Neural Networks.
Regression estimation, although in wide use even before the advent and coining of the term “Machine Learning”, would be nowadays seen as an archetypal example of Supervised ML. Regression estimation can be divided into two subgroups: linear and logistic regressions.
Linear regression is a parametric technique used to predict a continuous dependent variable given a set of independent variables. It can have any of an infinite number of possible values.
In logistic regression, however, the outcome (dependent variable) only has a limited number of possible values. Hence, the logistic regression is used when the response variable is categorical in nature.
As linear regression techniques are more widely known, you will find here below a list of some logistic regressions and other forms of convenient hybrid regression techniques that can be used to estimate (among many other things) LGD in those modelling frameworks:
A number of recent academic studies have proposed the use of decision tree models for credit risk modelling. Tree models are non-linear and non-parametric models and are therefore more flexible in capturing data characteristics. They are an important algorithm method of Machine Learning with the purpose of predicting the value of a target variable by learning simple decision rules inferred from the historical data. They are easily interpretable, while delivering implementable output. Unfortunately, these models are prone to overfitting; a larger tree results in a better fit but possibly worse out of sample predictions. It could be noted that the extreme case of just a single observation in every leaf will result in a perfect fit but probably rather poor out of sample predictions.
Decision trees include:
Support vector machines are supervised learning models with associated learning algorithms that analyse the data used for classification and regression analysis. Given a set of training examples, each marked as belonging to one or the other of two categories, an SVM training algorithm builds a model that assigns new examples to one category or the other, making it a non-probabilistic binary linear classifier. The method has already gained momentum in credit risk modelling, where a Weighted Support Vector Machine algorithm is used for PD and LGD estimations.
An increasing number of academics and practitioners suggest using Artificial Neural Networks for modelling PDs and LGDs. This computing process, designed to associate, aggregate, analyse and disassociate inputs in a manner similar to the way a human brain processes the information, consists of a group of elementary processing units (akin to neurons) interconnected in such a way that the information always moves in one direction. The most prominent type of feed-forward network is the multilayer perceptron, in which the neurons are organised in layers and each neuron in one layer is directly connected to the neurons in the subsequent layer. In practice, multilayer perceptrons with three layers are mostly used. The input layer consists of m+1 inputs corresponding to m explanatory variables and an additional constant input called the bias. The output layer contains a number of neurons equal to the number of dependent variables (one in this case).
The layer between the input and output layers is called the hidden layer. The number of neurons in the hidden layer is determined by optimizing the network performance. The output of each neuron is weighted sum of its inputs that goes through some activation function. The weights are adjusted by a non-linear optimization algorithm, called gradient descent, which follows the contours of the error surface along the direction of the steepest slope. Commonly chosen activation functions for the hidden neurons are the logistic function and the hyperbolic tangent. Learning occurs by comparing the network output with the desired one, and adjusting iteratively the connection weights in order to minimize the loss function.
Ensemble Learning is the process by which multiple models are strategically generated and combined to solve a particular computational intelligence problem. Ensemble Learning is primarily used to improve the performance of a model, or reduce the likelihood of selecting a poor one. Other applications of Ensemble Learning include assigning a confidence to the decision made by the model, selecting optimal (or near optimal) features, data fusion, incremental learning, nonstationary learning and error-correcting. Combining several models to make a final prediction is not often considered. Using an ensemble or a collection of models rather than a single model can improve the accuracy and robustness of prediction results. Implementing Ensemble Learning methods has proved very efficient in estimating LGD. There are two main categories:
The Random Forest algorithm builds decision trees out of random samples of the data and a random selection of features. The production phase of random samples is called bootstrap aggregating (also known as bagging) with the aim of producing m new training sets Di of size n out of one initial training set D of size n by sampling from D uniformly and with replacement.
After training, predictions for unseen samples can be made by averaging the predictions from all the individual regression trees. This bootstrapping procedure leads to better model performance because it decreases the variance of the model, without increasing the bias. This means that while the predictions of a single tree are highly sensitive to noise in its training set, the average of many trees is not, as long as the trees are not correlated. In many scenarios, Random Forest gives much more accurate predictions when compared to simple decision trees or linear models.
Gradient Boosting is an ensemble technique that is rooted in the concept of Gradient descent, a first-order optimization algorithm that is usually used to calculate a function’s local minimum. It produces a prediction model in the form of an ensemble of weak prediction models, typically decision trees. It builds the model similarly to other boosting methods and it generalizes them by allowing the optimization of an arbitrary differentiable loss function.
Unsupervised machine learning uses only input data (X), while no corresponding output variables are defined. The aim is to reveal the underlying distribution or structure of the data without placing restrictions on the model. Several methods of unsupervised machine learning have been suggested for potential uses in credit risk modelling:
Particularly, in Deep Learning, multiple layers of algorithms are stacked to mimic neurons in the layered learning process of the human brain. Each of the algorithms is equipped to lift a certain feature from the data. This so-called representation or abstraction is then fed to the following algorithm, which again lifts out another aspect of the data. The stacking of representation-learning algorithms allows deep-learning approaches to be fed with all kinds of data, including low-quality, unstructured data, which is particularly relevant for the case of LDPs. The ability of the algorithms to create relevant abstractions of the data allows the system as a whole to perform a relevant analysis. Crucially, these layers of features are not designed by human engineers, but learned from the data using a general-purpose learning procedure.
Principal component analysis (PCA) is a mathematical procedure that transforms a number of (possibly) correlated variables into a smaller number of uncorrelated variables called principal components. The first principal component accounts for as much of the variability in the data as possible, and each succeeding component accounts for as much of the remaining variability as possible. PCA is a dimensionality reduction or data compression method. The goal is dimension reduction and there is no guarantee that the dimensions are interpretable. However, it is proposed as a tractable and easy-to-implement method for extracting market risk factors from observed data.
Clustering methods attempt to pick on trends and patterns in data via looking for “clusters” - data points that share or are close (or closer) to each other in some attributes. The principal method is the K-means clustering, where a given number of centroids (arbitrary reference points) are placed into a random location in the space that maps the data sample across observable dimensions and the distance between centroids and individual data points is calculated as to assign each data point to the nearest centroid. Centroids are then shifted to minimise the mean distance between themselves and the data points assigned to them. Data points are then reassigned depending on which centroid they are now closest to and the centroids shift their location to reduce the mean distance once again. The process is over when no data point changes the centroid it is assigned to after the centroids have been shifted to minimise the mean distance.
Due to rapid developments in data collection and computing power, machine learning is becoming increasingly important in technology and business. Its applications might become widely used in risk management, laying foundations to a new generation of better predicting models. As a company that specializes in technology and finance, Finalyse is aiming at enhancing all of its skills that would be required to engender and implement new modelling frameworks based on machine learning. However, at the same time, we remain aware of the limitations that machine learning models entail:
Finally, even if machine learning models represent improved predictors based on artificial intelligence, they are still not human beings. Their results will depend on how the human interaction sets the required parameters and positions the general framework of the model.
Machine learning models will be particularly valuable in risk modelling but their added value will depend on the human interaction and knowledge when building the models.
Figure 1. Machine Learning techniques with potential applications in Risk Management
Finalyse InsuranceFinalyse offers specialized consulting for insurance and pension sectors, focusing on risk management, actuarial modeling, and regulatory compliance. Their services include Solvency II support, IFRS 17 implementation, and climate risk assessments, ensuring robust frameworks and regulatory alignment for institutions. |

Check out Finalyse Insurance services list that could help your business.
Get to know the people behind our services, feel free to ask them any questions.
Read Finalyse client cases regarding our insurance service offer.
Read Finalyse blog articles regarding our insurance service offer.
Designed to meet regulatory and strategic requirements of the Actuarial and Risk department
Designed to meet regulatory and strategic requirements of the Actuarial and Risk department.
Designed to provide cost-efficient and independent assurance to insurance and reinsurance undertakings
Finalyse BankingFinalyse leverages 35+ years of banking expertise to guide you through regulatory challenges with tailored risk solutions. |

Designed to help your Risk Management (Validation/AI Team) department in complying with EU AI Act regulatory requirements
A tool for banks to validate the implementation of RWA calculations and be better prepared for CRR3 in 2025
In 2027, FRTB will become the European norm for Pillar I market risk. Enhanced reporting requirements will also kick in at the start of the year. Are you on track?
Finalyse ValuationValuing complex products is both costly and demanding, requiring quality data, advanced models, and expert support. Finalyse Valuation Services are tailored to client needs, ensuring transparency and ongoing collaboration. Our experts analyse and reconcile counterparty prices to explain and document any differences. |

Helping clients to reconcile price disputes
Save time reviewing the reports instead of producing them yourself
Helping institutions to cope with reporting-related requirements
Be confident about your derivative values with holistic market data at hand
Finalyse PublicationsDiscover Finalyse writings, written for you by our experienced consultants, read whitepapers, our RegBrief and blog articles to stay ahead of the trends in the Banking, Insurance and Managed Services world |

Finalyse’s take on risk-mitigation techniques and the regulatory requirements that they address
A regularly updated catalogue of key financial policy changes, focusing on risk management, reporting, governance, accounting, and trading
Read Finalyse whitepapers and research materials on trending subjects
About FinalyseOur aim is to support our clients incorporating changes and innovations in valuation, risk and compliance. We share the ambition to contribute to a sustainable and resilient financial system. Facing these extraordinary challenges is what drives us every day. |

Finalyse CareersUnlock your potential with Finalyse: as risk management pioneers with over 35 years of experience, we provide advisory services and empower clients in making informed decisions. Our mission is to support them in adapting to changes and innovations, contributing to a sustainable and resilient financial system. |

Get to know our diverse and multicultural teams, committed to bring new ideas
We combine growing fintech expertise, ownership, and a passion for tailored solutions to make a real impact
Discover our three business lines and the expert teams delivering smart, reliable support